Liquidity Hunter — 1 Year Access
1-Year Access · Liquidity Hunter
Liquidity sweeps, market structure and key zones for TradingView.
Built to track smart money behaviour and high-probability areas.
Activation within 24 hours · All updates included · TradingView username required
Original price was: $79.99.$19.99Current price is: $19.99.
What you get
1-Year Access · Liquidity Hunter
Liquidity sweeps, market structure and key zones for TradingView.
Built to track smart money behaviour and high-probability areas.
Activation within 24 hours · All updates included · TradingView username required
Details
Liquidity Hunter beta — 1 Year Access
A multi-layer TradingView framework that visualizes trend structure, reversal zones,
liquidity traps, and momentum shifts — with clean, readable chart context.
Liquidity Hunter is built as an analysis tool. It does not promise “magic signals”
or guaranteed outcomes. Instead, it helps you read market behaviour through a structured visual system.
The indicator provides structure and context — you make the decision.
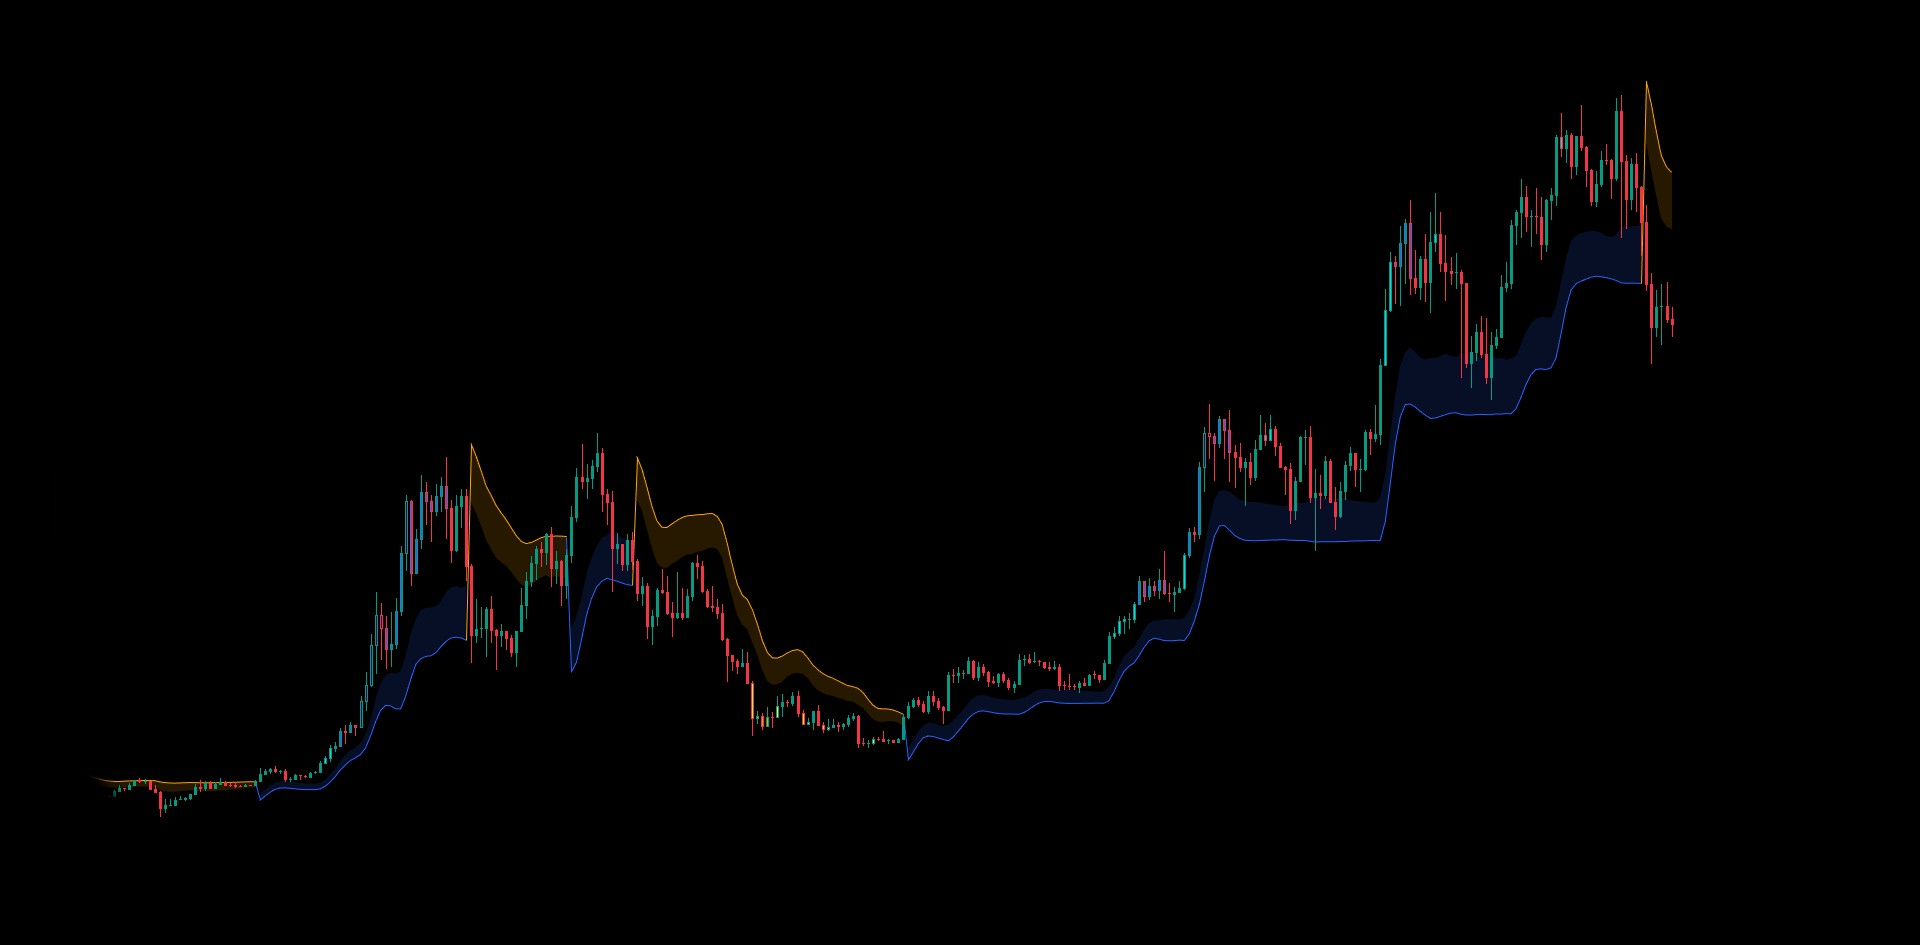
1) Smart Trend
A clean trend backbone designed to stay readable during volatility and reduce noise.
- Trend lines: displayed as separate bullish/bearish regimes for quick reading.
- Trend cloud: a volatility-aware buffer around the trend line to show “trend space”.
- Flip connector: a visual bridge that marks regime shifts and makes transitions easy to spot.
- Mode switch: two sensitivity modes for faster or slower trend behaviour (user-selectable).
(clouds, traps, signals) for context and timing.
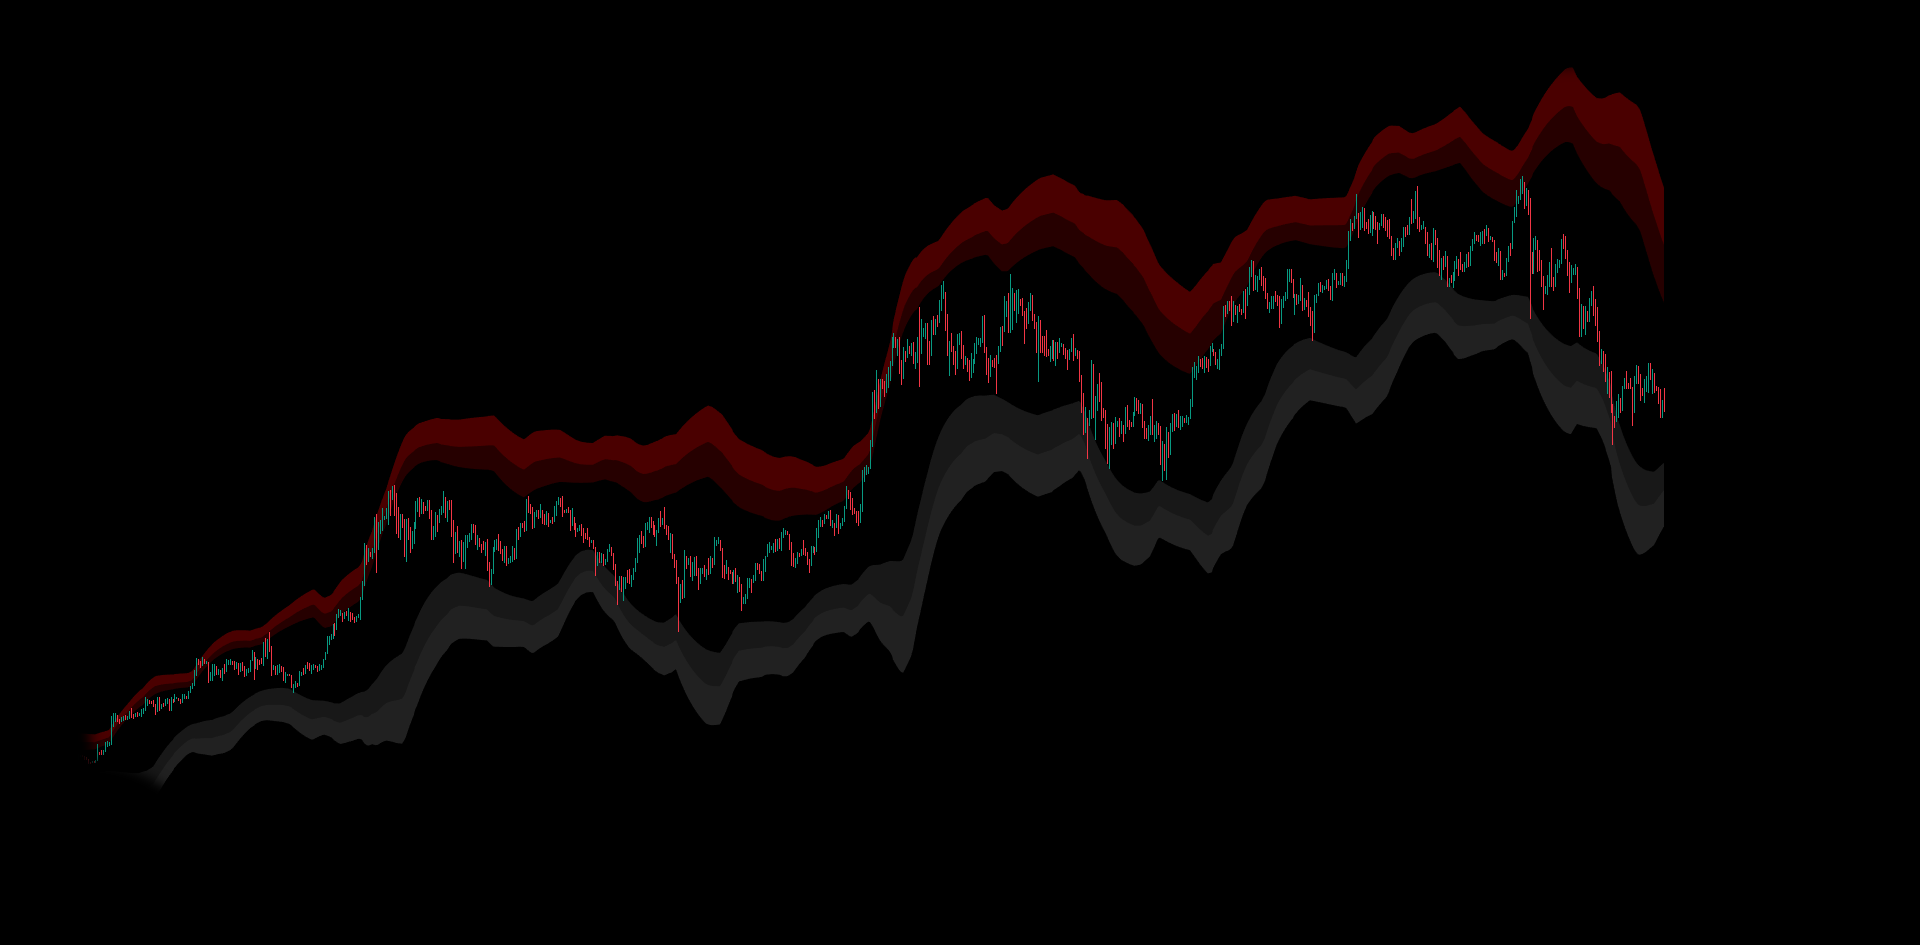
2) Reversal Zone Cloud
Visual zones that map price expansion / mean-reversion areas using layered cloud bands.
Upper bands
Used to highlight potential overextension zones above price structure.
Lower bands
Used to highlight potential compression / exhaustion zones below structure.
Power presets
Choose how “tight” or “wide” the zones appear (Turbo → Wide) depending on your style.
Custom colours
Independent colour control for upper/lower bands for a clean, consistent visual workflow.
They help you spot where price may slow down, reject, or mean-revert.
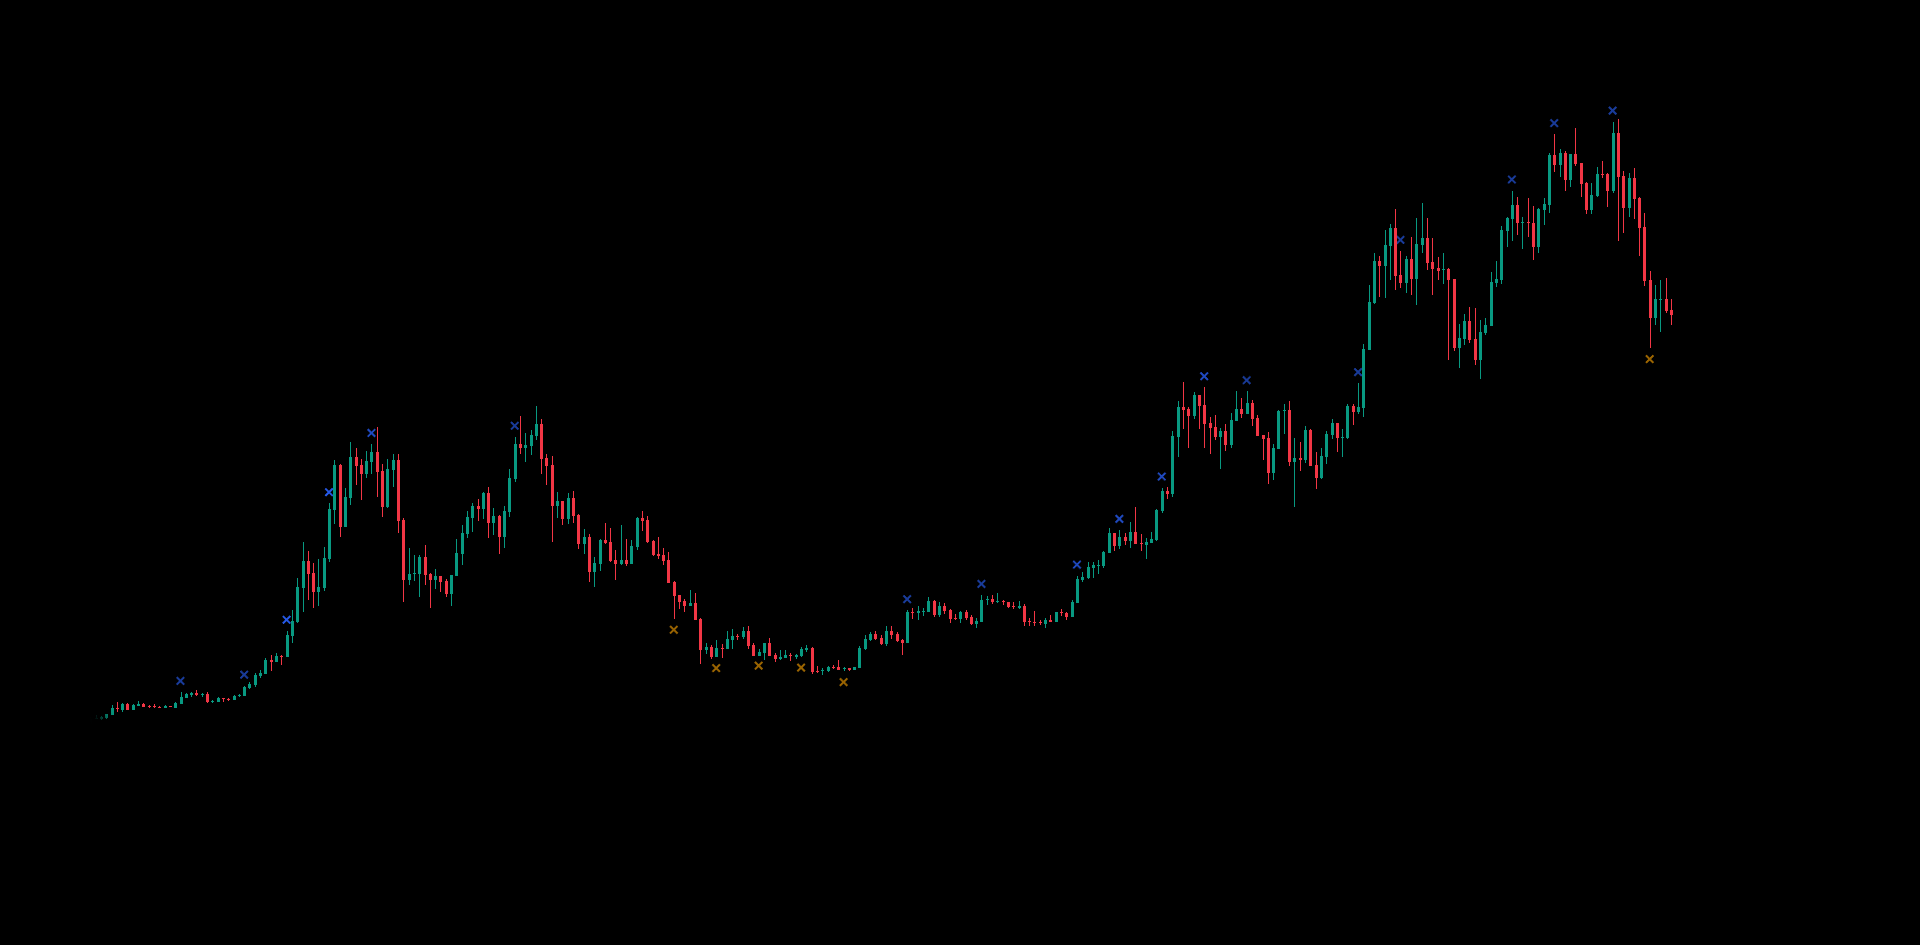
3) X-Cross Alerts
Lightweight alert markers that trigger when price reaches key zone levels — with built-in anti-spam cooldown.
- Upper X-Cross: appears above bars when price reaches upper zone levels.
- Lower X-Cross: appears below bars when price reaches lower zone levels.
- Alert Power: sensitivity preset (Turbo → Macro) to match timeframe and trading style.
- Cooldown logic: prevents repeated spam signals and keeps charts clean.
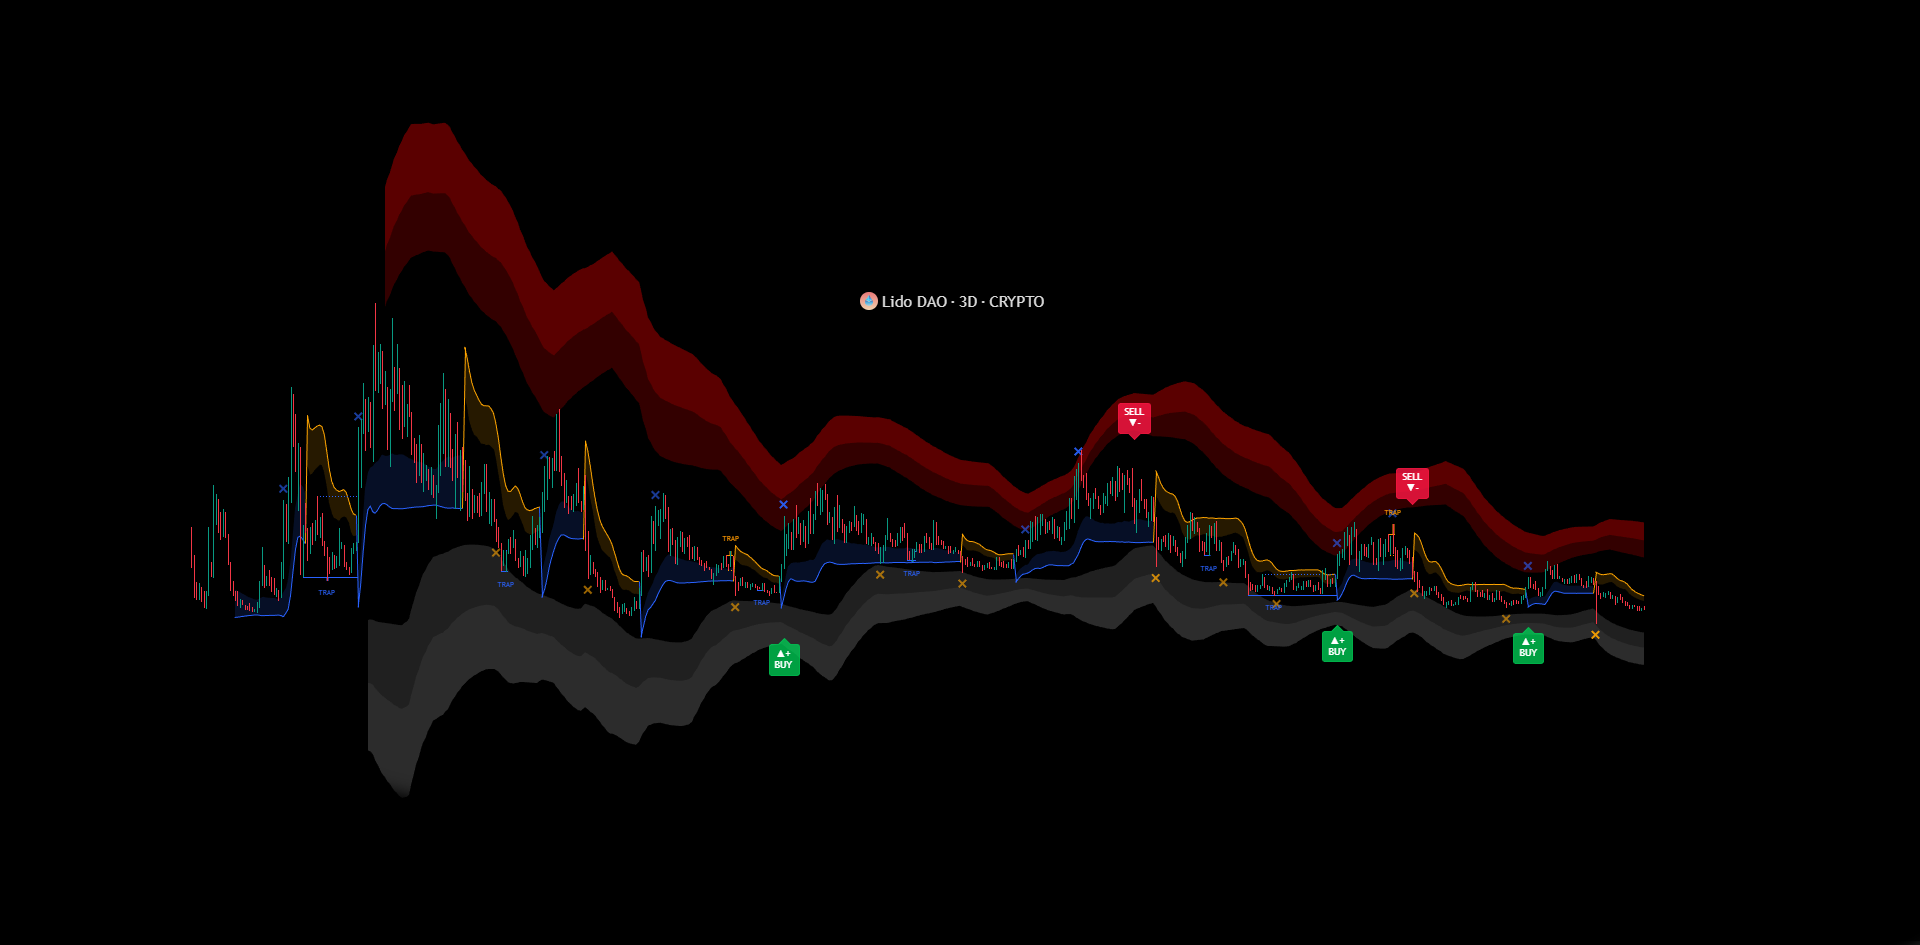
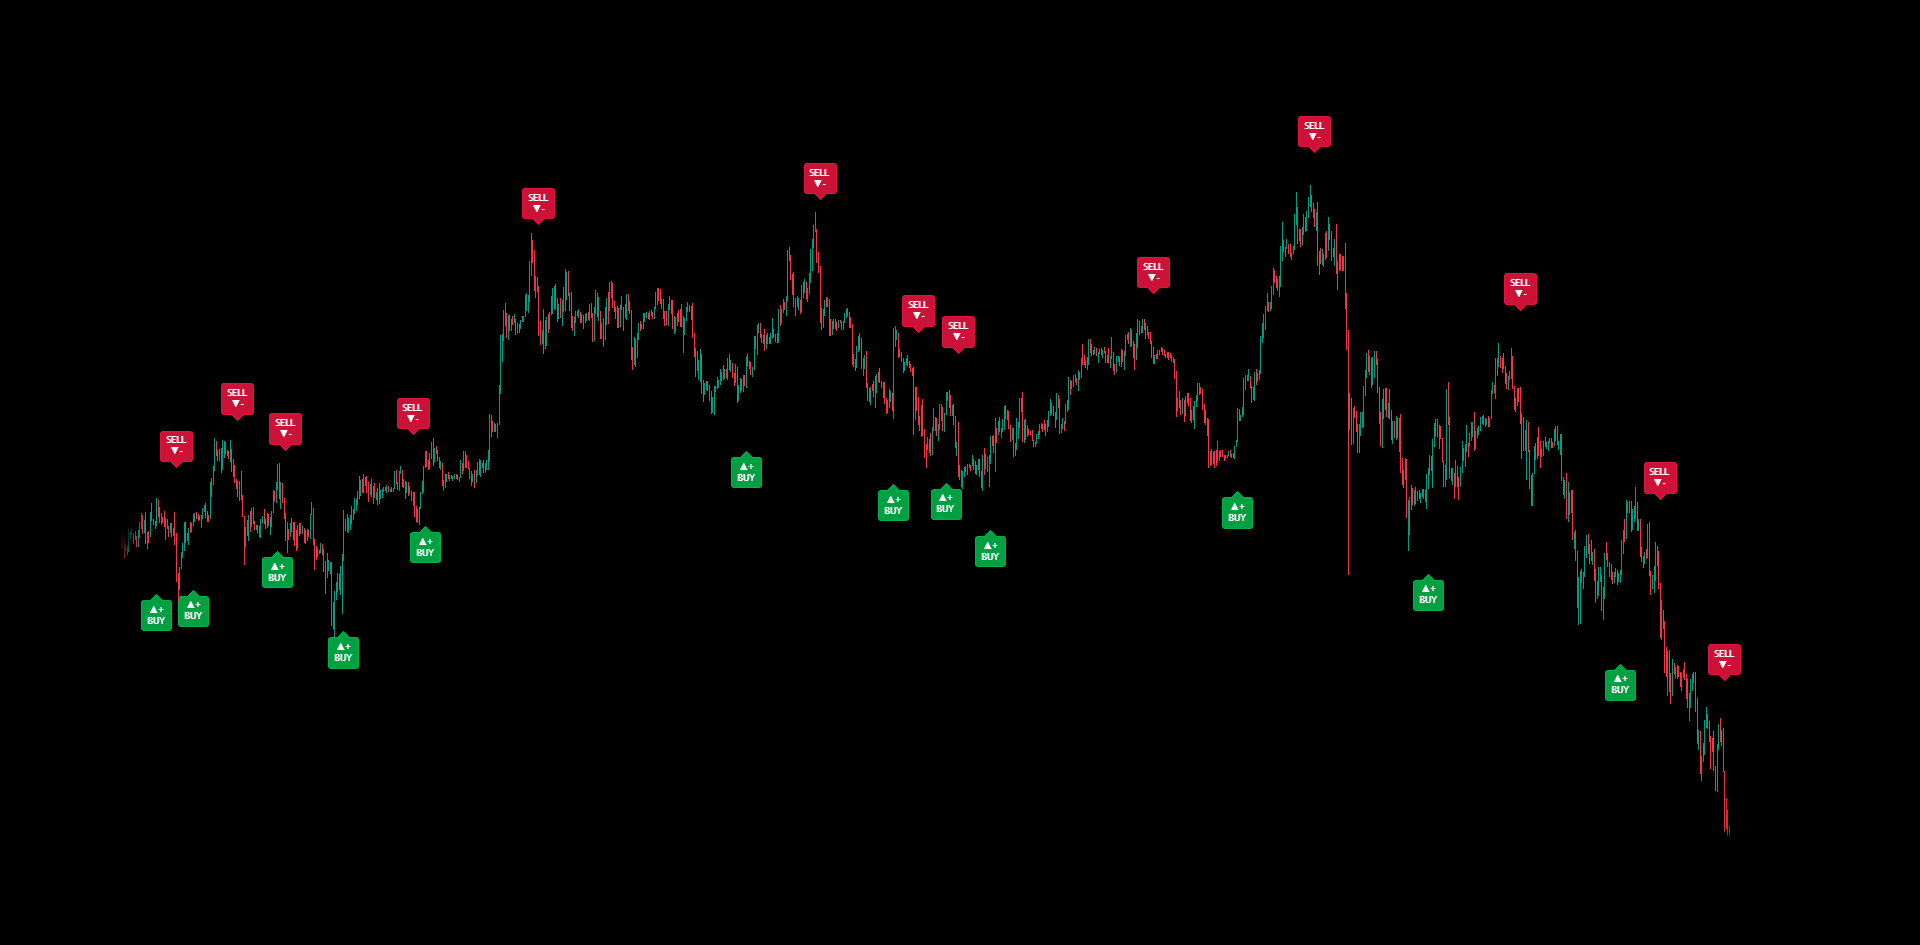
4) Rum Buy & Sell Signals (beta)
Optional momentum-shift labels designed to highlight regime changes — not to replace risk management.
BUY label
Marks a bullish momentum shift when internal trend state flips upward.
SELL label
Marks a bearish momentum shift when internal trend state flips downward.
Clean placement
Labels are positioned with volatility-aware spacing so they stay readable on different markets.
Alerts included
TradingView alerts can be enabled for these label events for monitoring.
Smart Trend bias and cloud reaction areas.
5) Trap Hunter
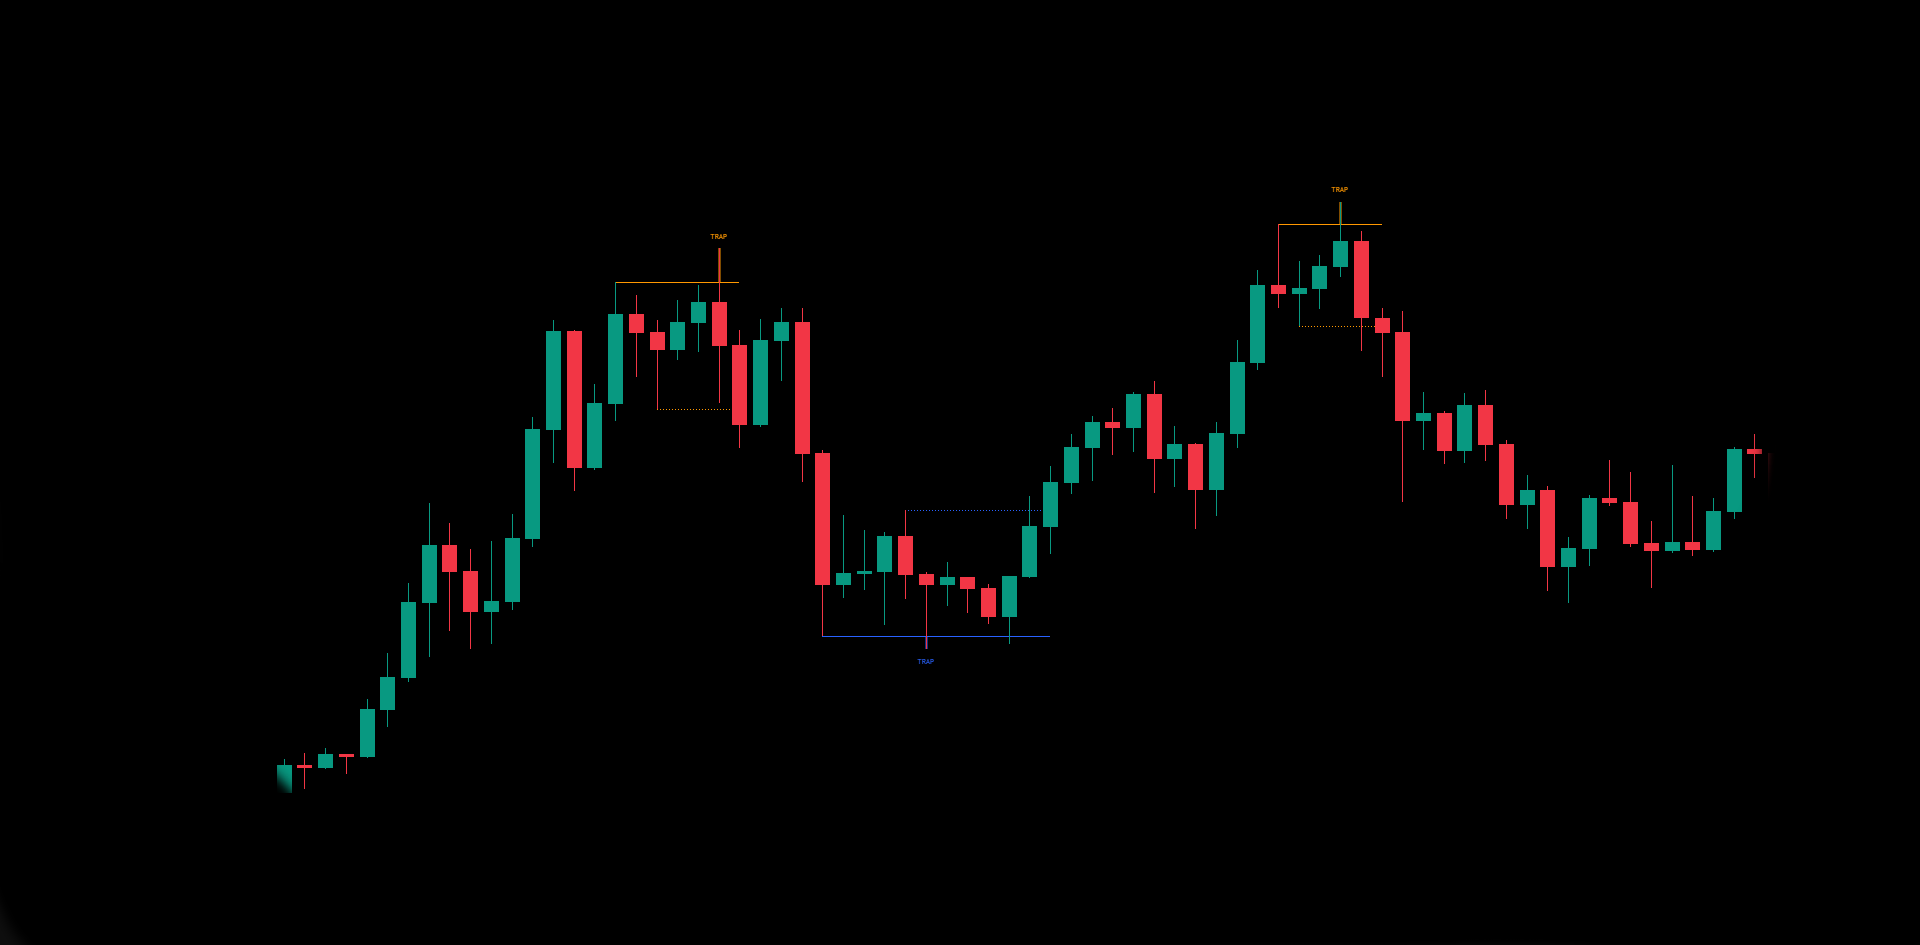
A dedicated module that highlights potential liquidity traps and failed breakouts around recent swing levels.
- Trap levels: visual reference lines derived from recent swing behaviour.
- Wick emphasis: highlights trap wicks to make false breaks easy to spot.
- Confirmation / invalidation: traps evolve — they can confirm, expire, or invalidate based on price behaviour.
- Designed for clarity: drawings are kept within safe limits to avoid overloading the chart.
Use it to identify where the market “punishes” aggressive breakouts.
6) Overbought & Oversold — Bar Colours
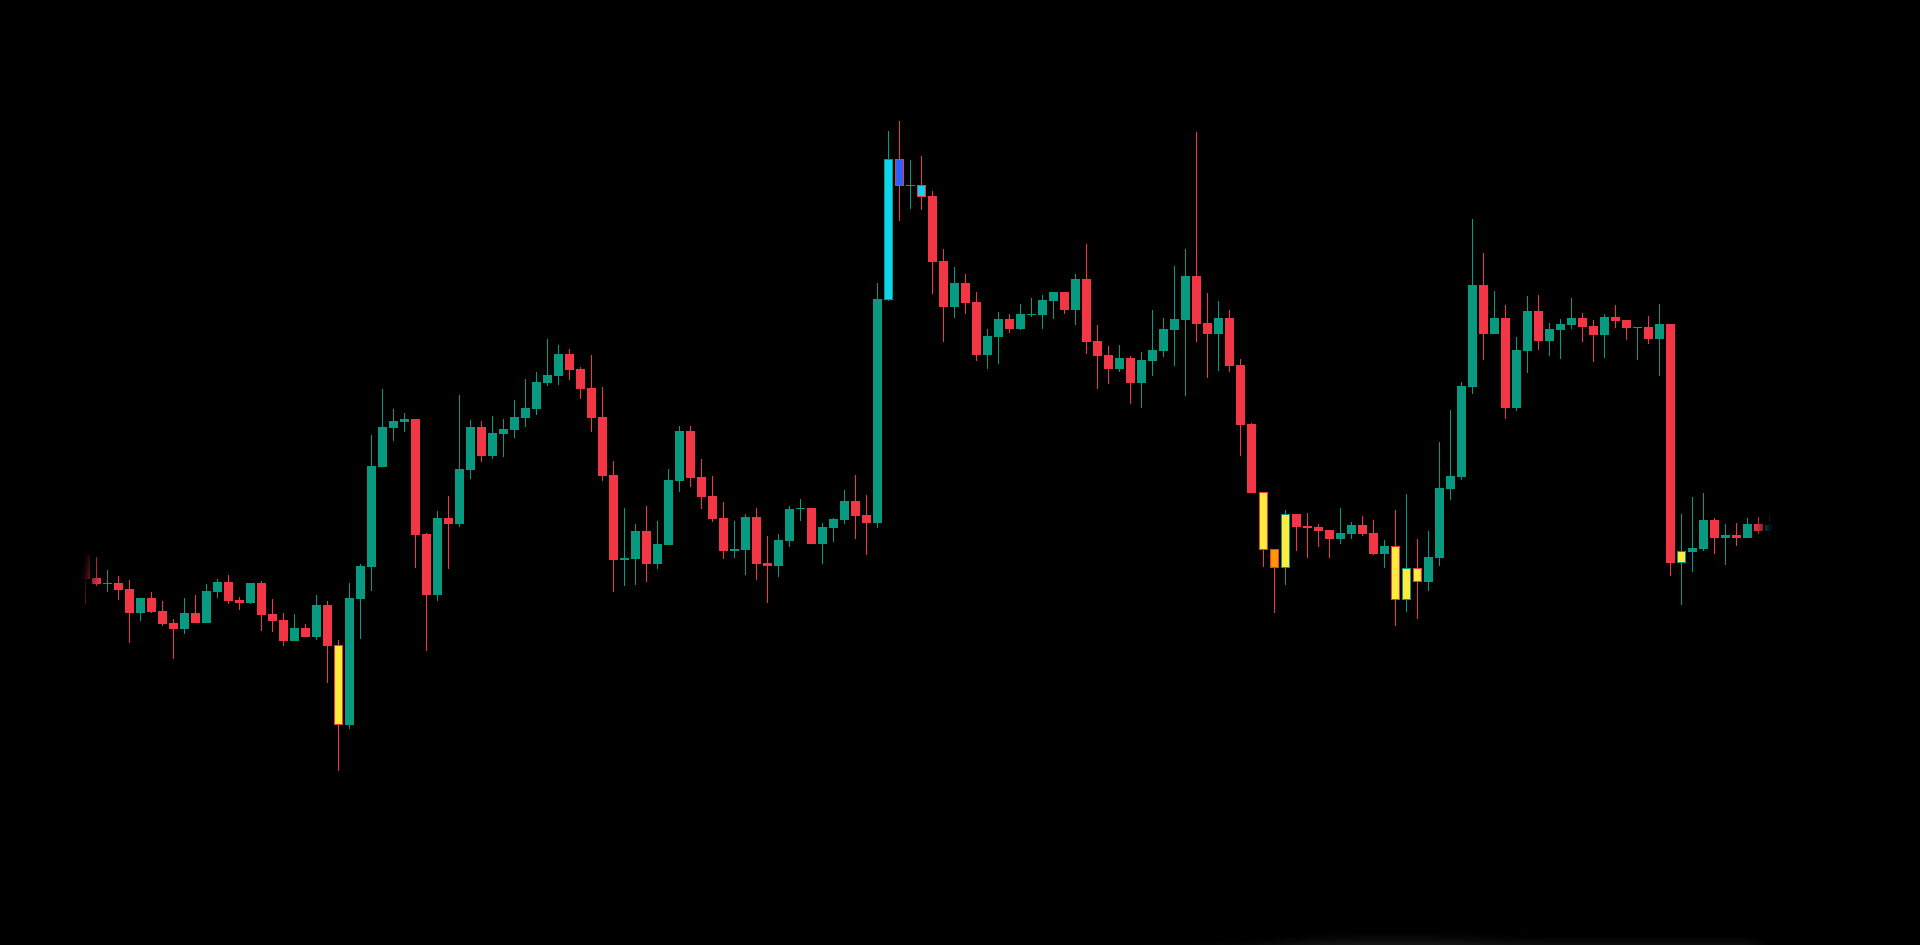
Optional candle colouring to highlight extension states and improve situational awareness.
Overbought tiers
Multiple colour tiers as price becomes increasingly extended to the upside.
Oversold tiers
Multiple colour tiers as price becomes increasingly extended to the downside.
Recommended Workflow
A simple way to combine modules without overcomplicating.
- Start with Smart Trend: define bias (bullish / bearish).
- Use Reversal Zone Cloud: locate reaction areas where price may slow down or revert.
- Confirm with Trap Hunter: watch for failed breaks / liquidity traps near structure levels.
- Use X-Cross & Rum Signals: as monitoring / timing markers — not standalone trade commands.
Access & Activation
Private TradingView script delivery.
- Access period: 1 Year.
- Updates: included during access period.
- Activation: typically within 24 hours.
- TradingView username: required to grant access.
It does not provide financial advice and does not guarantee results.
Related products
-
Smart Trend Old
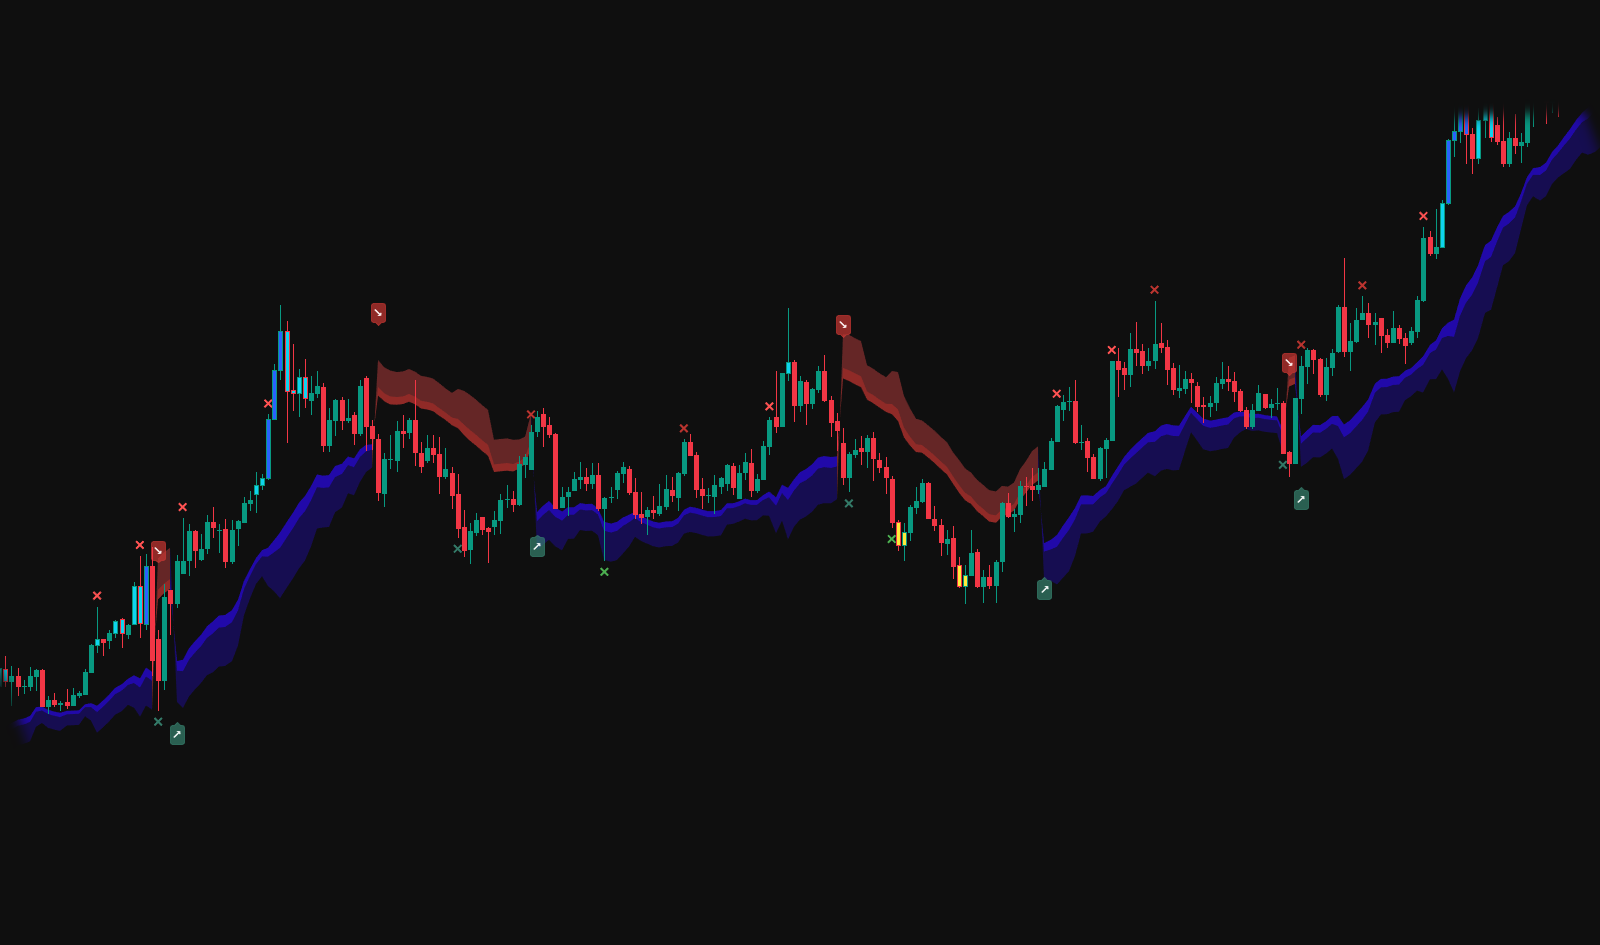
Smart Trend (Legacy) · By Request (Included) Earlier Smart Trend module: clean trend direction + structured zones for disciplined context. Provided as a private add-on after selected premium purchases. Activation within 24 hours · All updates included · TradingView username required.$9.99 -
Safety Trade – Public on TradingView
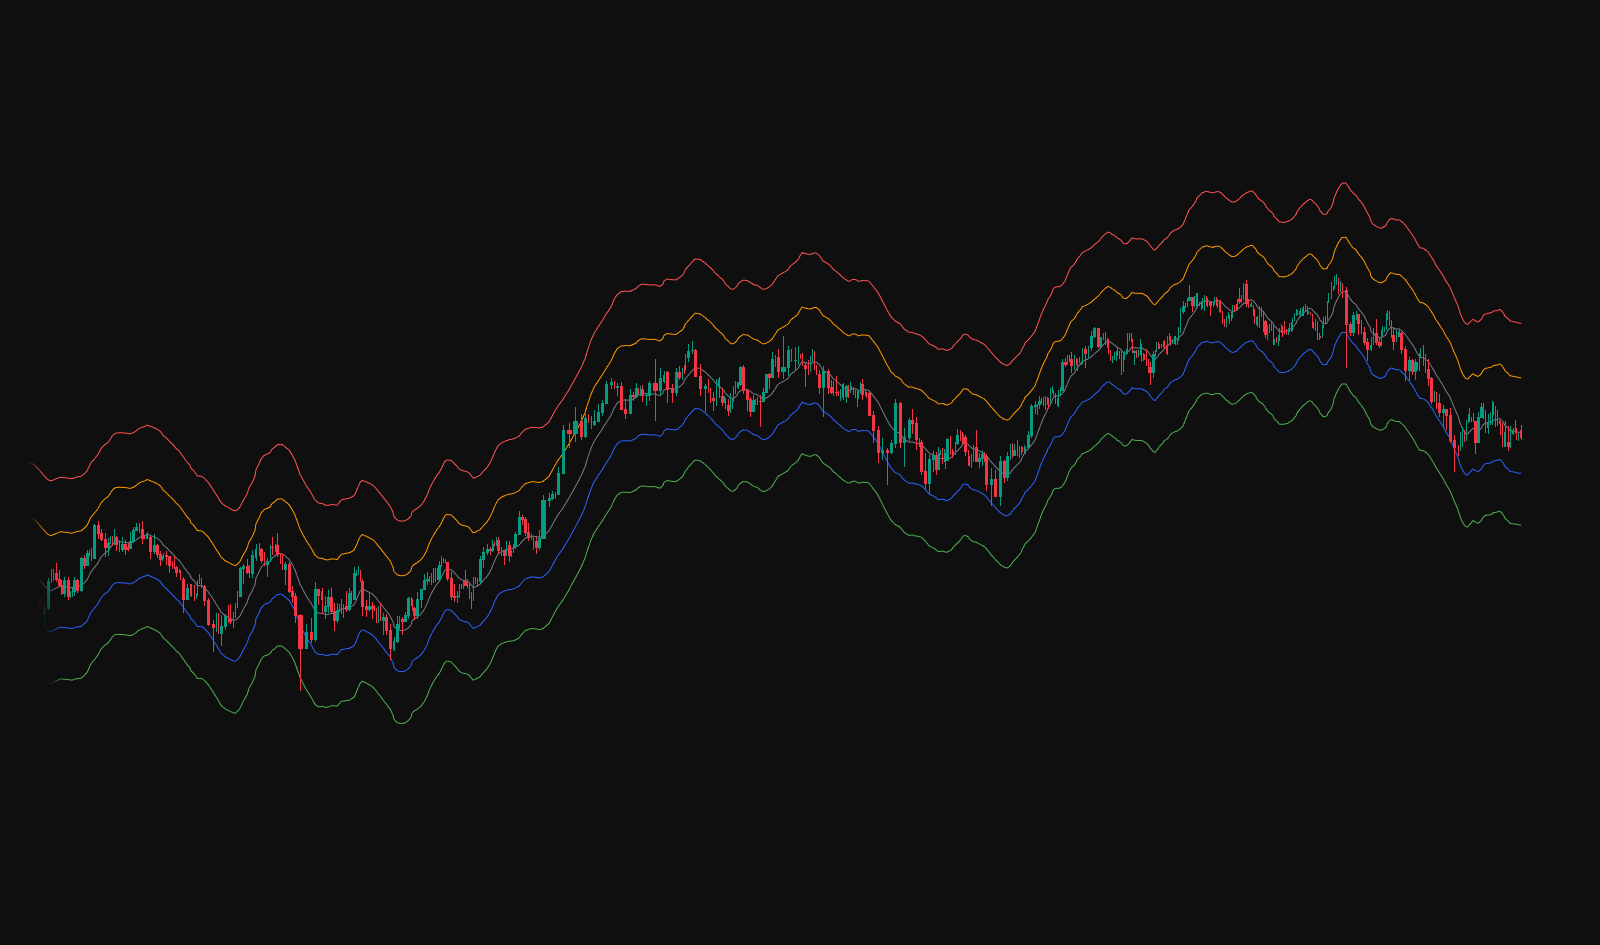
Free · Safety Trade A clean TradingView overlay with structured reference levels for clarity and discipline. Built to keep charts readable and help you stay objective across timeframes. Public on TradingView · All updates included · No activation required. -
Test Indicator — 1-Week Demo Access
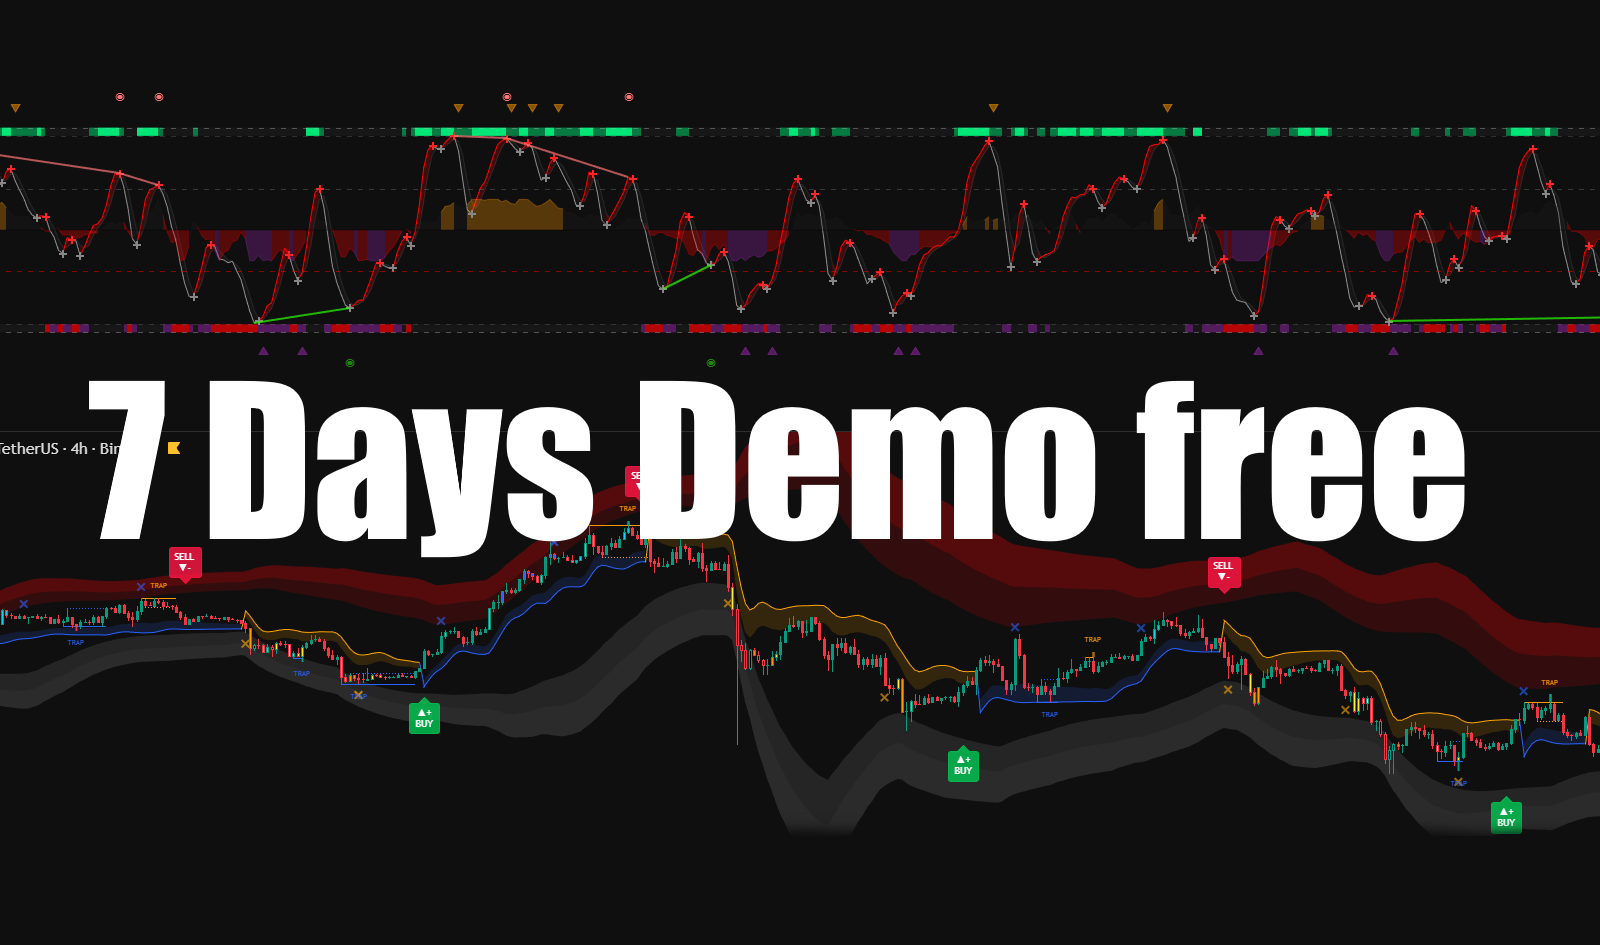
7-Day Demo Access Test the full RUMIANCEV workflow — indicators, signals and tools. Explore the logic and experience before upgrading to full access. Free demo · TradingView only · TradingView username required$0.00 -
Trap Lines — Included with iFlow + Liquidity Hunter
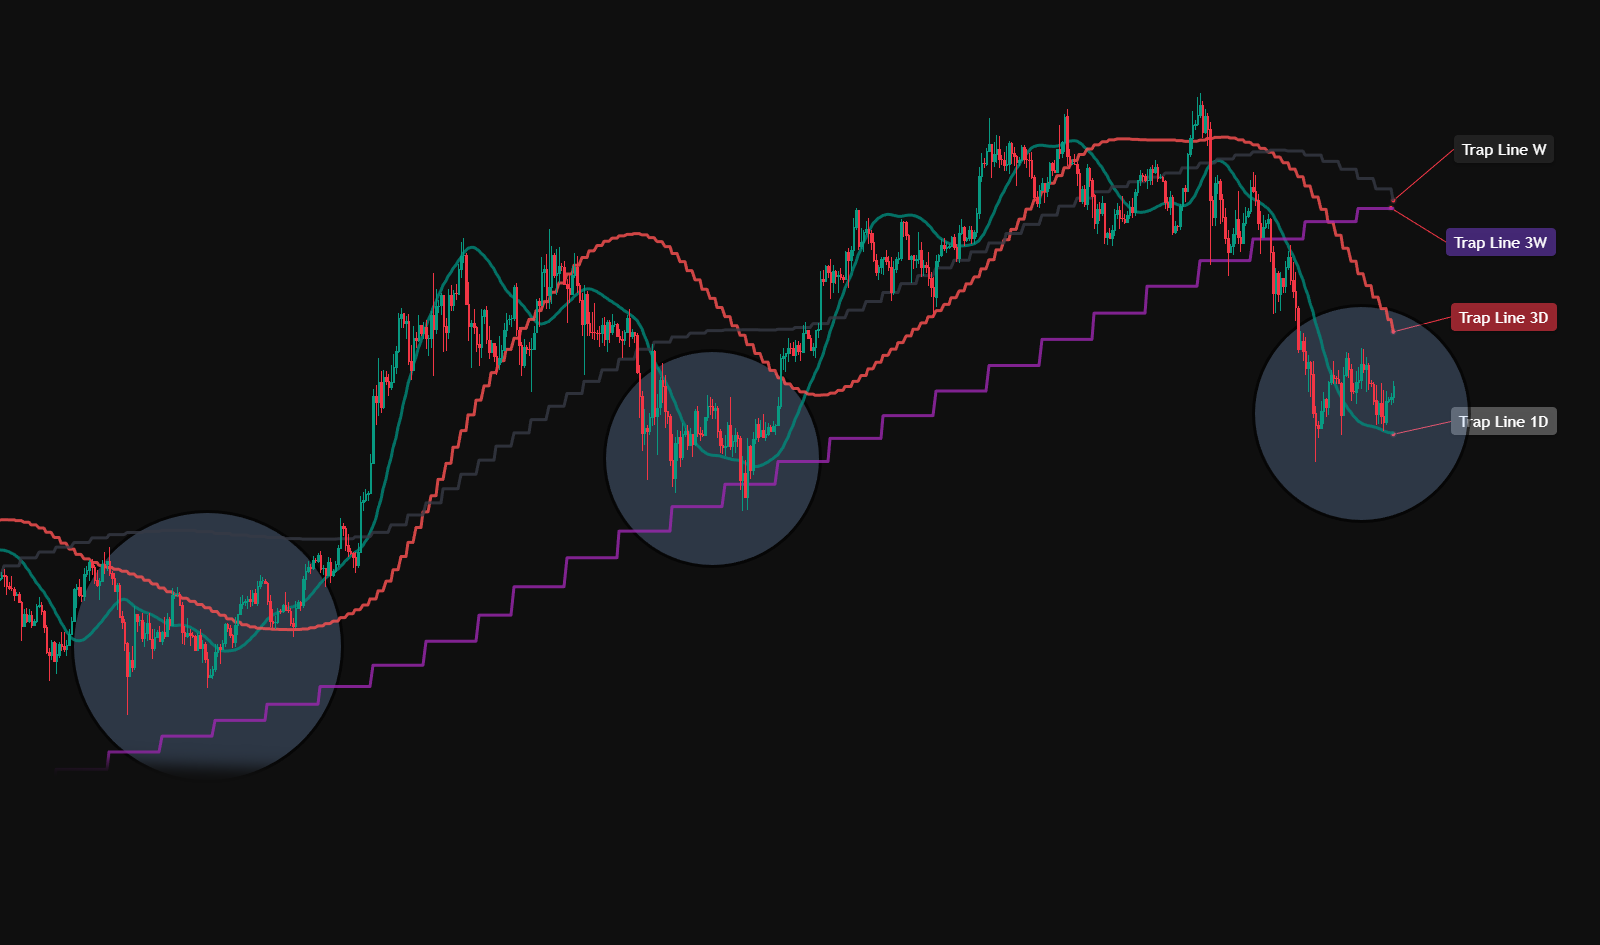
1-Year Access · Trap Lines (Included) Included with iFlow Oscillator & the iFlow + Liquidity Hunter bundle. Dynamic reaction lines to help you stay oriented and trade with structure. Activation within 24 hours · All updates included · TradingView username required