Liquidity Hunter & iFlow Oscillator — 1 Year Access
1-Year Bundle Access · Liquidity Hunter + iFlow
Complete toolkit for trend, flow and precise entries on TradingView.
Combines liquidity analysis with momentum and internal market flow.
Activation within 24 hours · All updates included · TradingView username required
Original price was: $99.00.$29.99Current price is: $29.99.
What you get
1-Year Bundle Access · Liquidity Hunter + iFlow
Complete toolkit for trend, flow and precise entries on TradingView.
Combines liquidity analysis with momentum and internal market flow.
Activation within 24 hours · All updates included · TradingView username required
Details
iFlow Oscillator — 1 Year Access
A clean momentum + flow oscillator for TradingView: Zero-RSI trend shifts, signal crosses,
Money Flow pressure (scaled), status blocks, and divergence detection — designed to confirm moves, not chase them.
iFlow is built as an analysis & confirmation tool. It does not promise guaranteed entries
or “perfect signals”. Instead, it helps you see when momentum and money-flow align (or diverge),
so you can make more objective decisions.
When combined with Liquidity Hunter, you get both structure and internal strength.
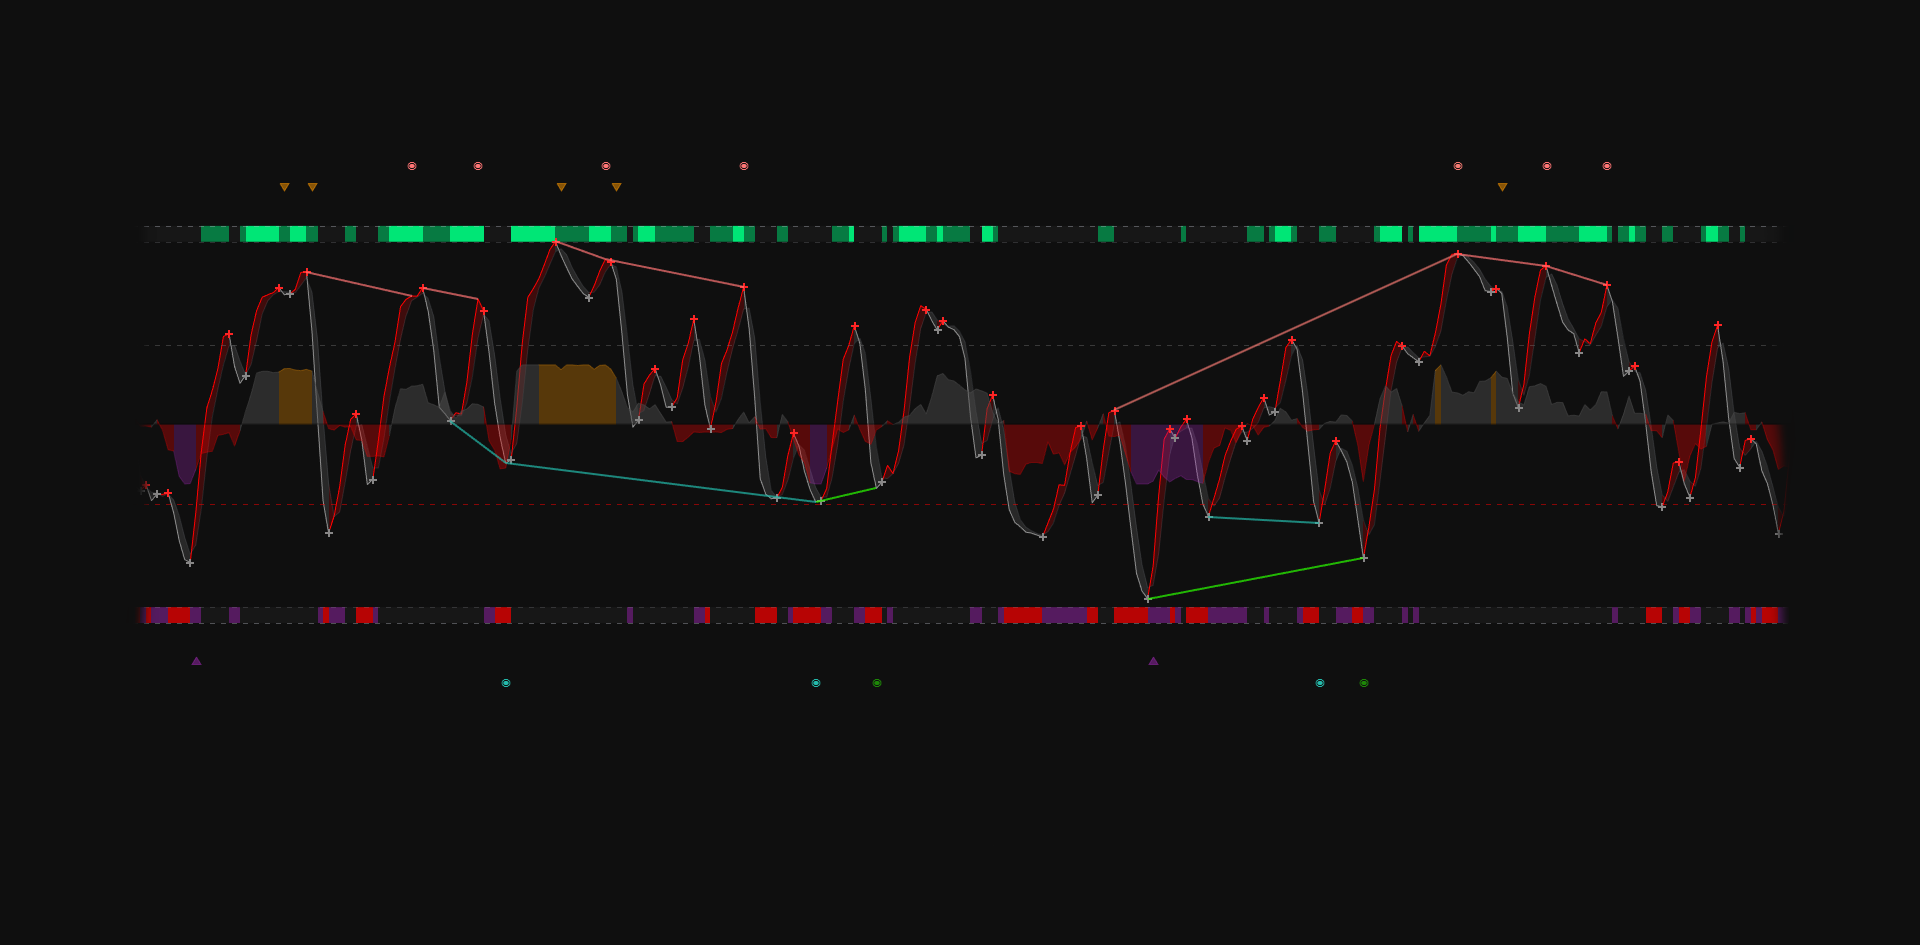
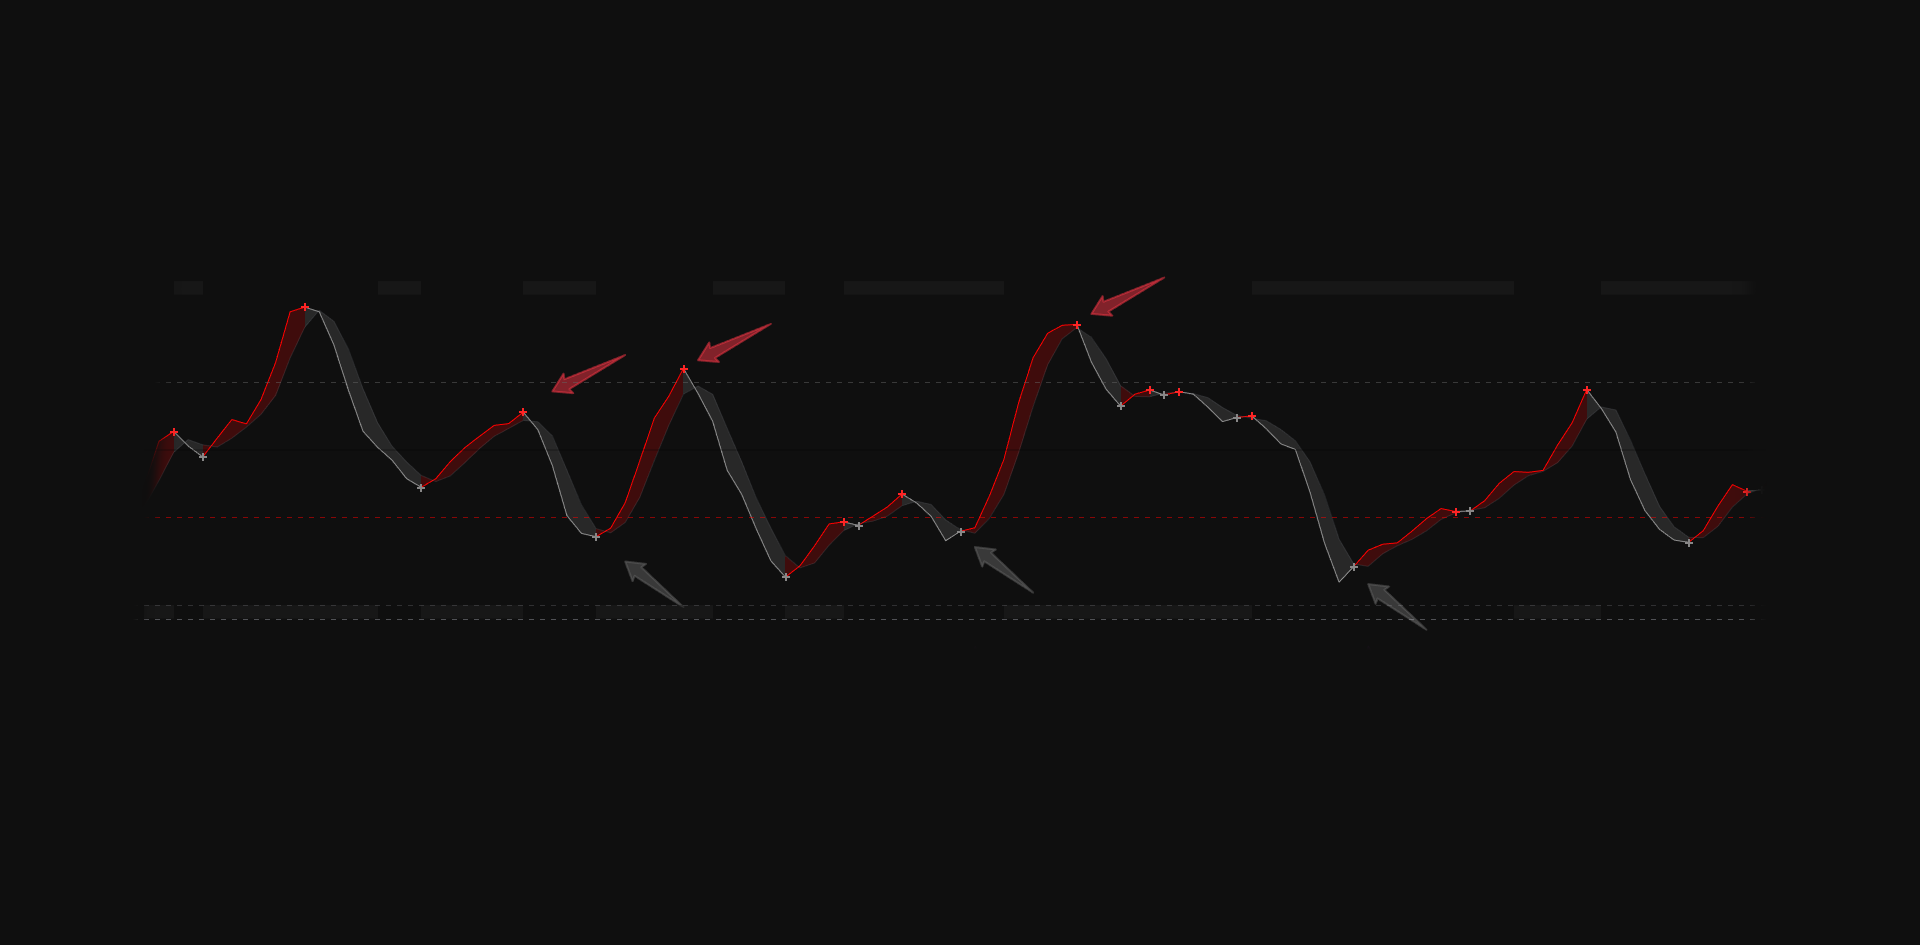
1) Zero-RSI Core (RSI − 50)
RSI is shifted to a zero median, making momentum regimes easier to read:
above 0 = stronger, below 0 = weaker.
- Fast response: short RSI length (default) to capture momentum changes early.
- Smoothing (optional): EMA / SMA / WMA smoothing to reduce noise.
- Signal line: SMA signal for clean cross logic and confirmations.
- Visual bias: RSI line changes color depending on whether RSI is above or below its signal.
then check whether RSI is above/below zero (momentum regime).
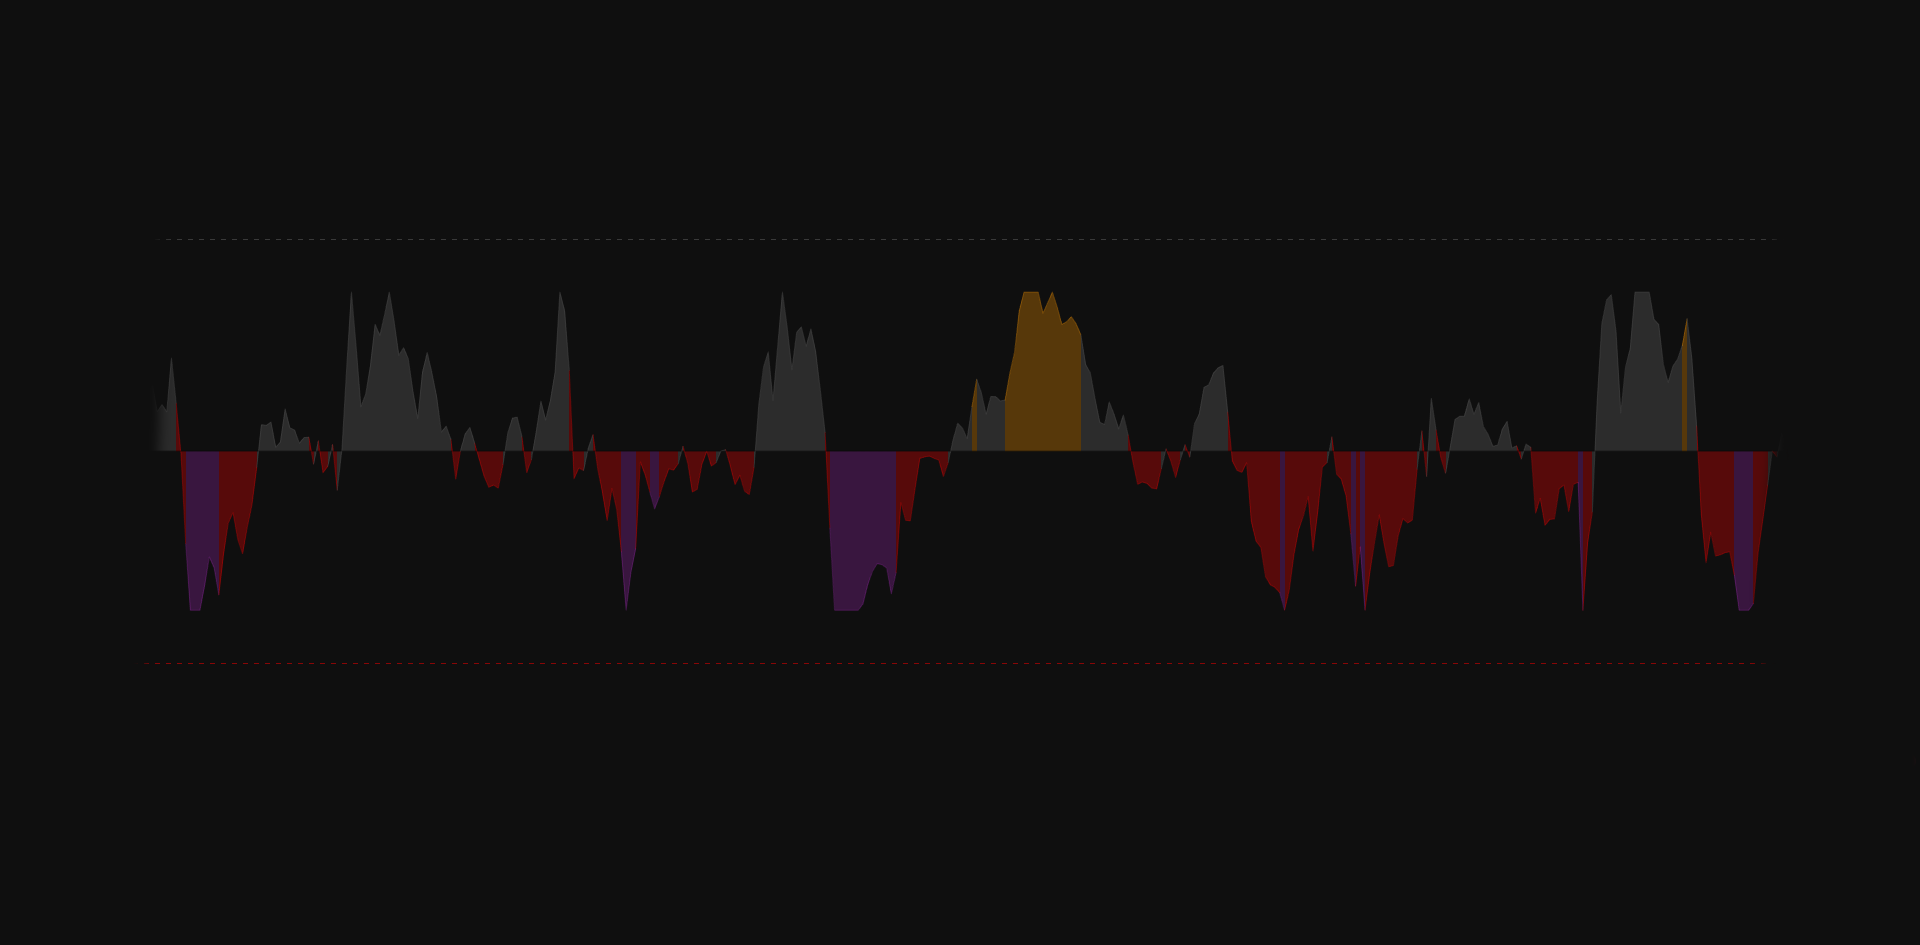
2) Money Flow Pressure (MFI Histogram)
A scaled Money Flow area that highlights pressure (accumulation / distribution)
and reacts to overbought/oversold MFI zones.
Scaled net flow
Net money flow is normalized and scaled, so you can compare flow strength visually across markets.
Regime coloring
Histogram adapts color depending on flow direction and MFI OB/OS states.
OB/OS thresholds
Custom MFI overbought / oversold levels to match your timeframe and trading style.
Context layer
Flow is best used as confirmation — strong momentum + strong flow is higher quality than momentum alone.
Flow helps you avoid taking crosses that happen without real pressure behind them.
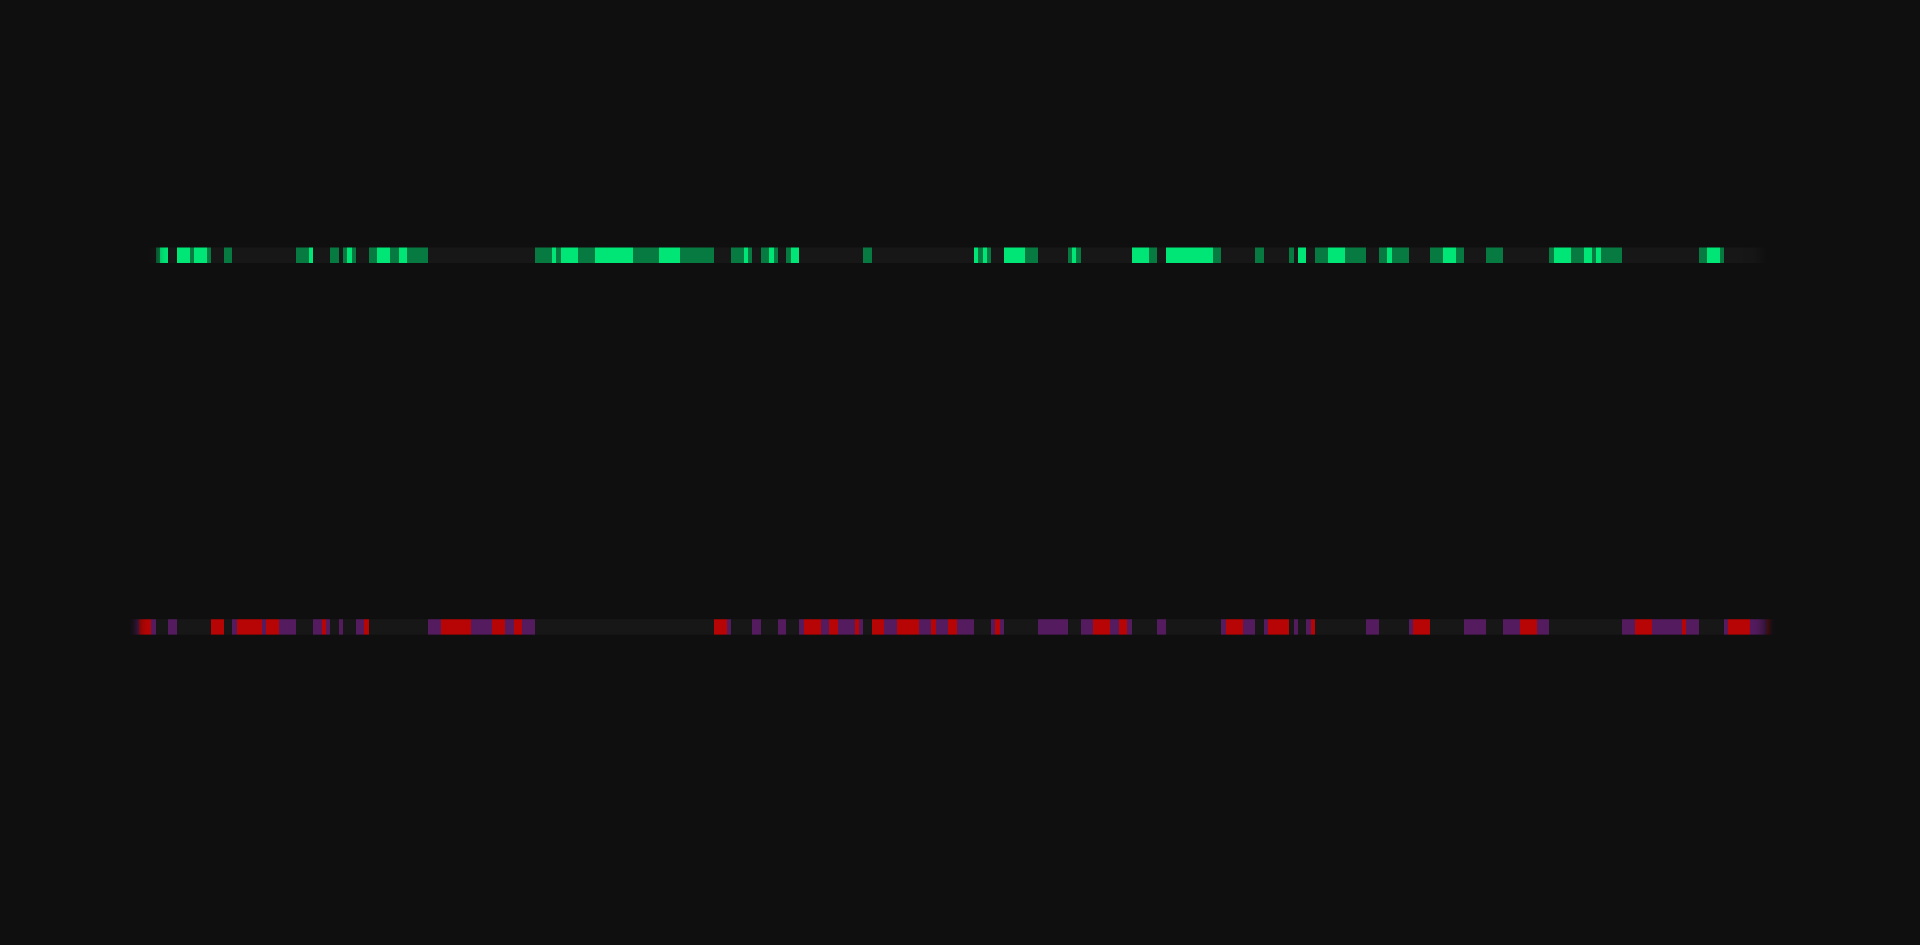
3) Status Blocks (Momentum Alignment)
Dynamic status blocks replace “noisy fills” and show whether momentum and flow are aligned.
- Score system: combines (RSI > Signal), (RSI > 0), and (Flow > 0).
- Upper block: turns stronger when alignment is bullish (score 2–3).
- Lower block: turns stronger when alignment is bearish (score 0–1).
- Clean UI: designed to keep the pane readable and reduce “color noise”.
be more selective and wait for clearer alignment.
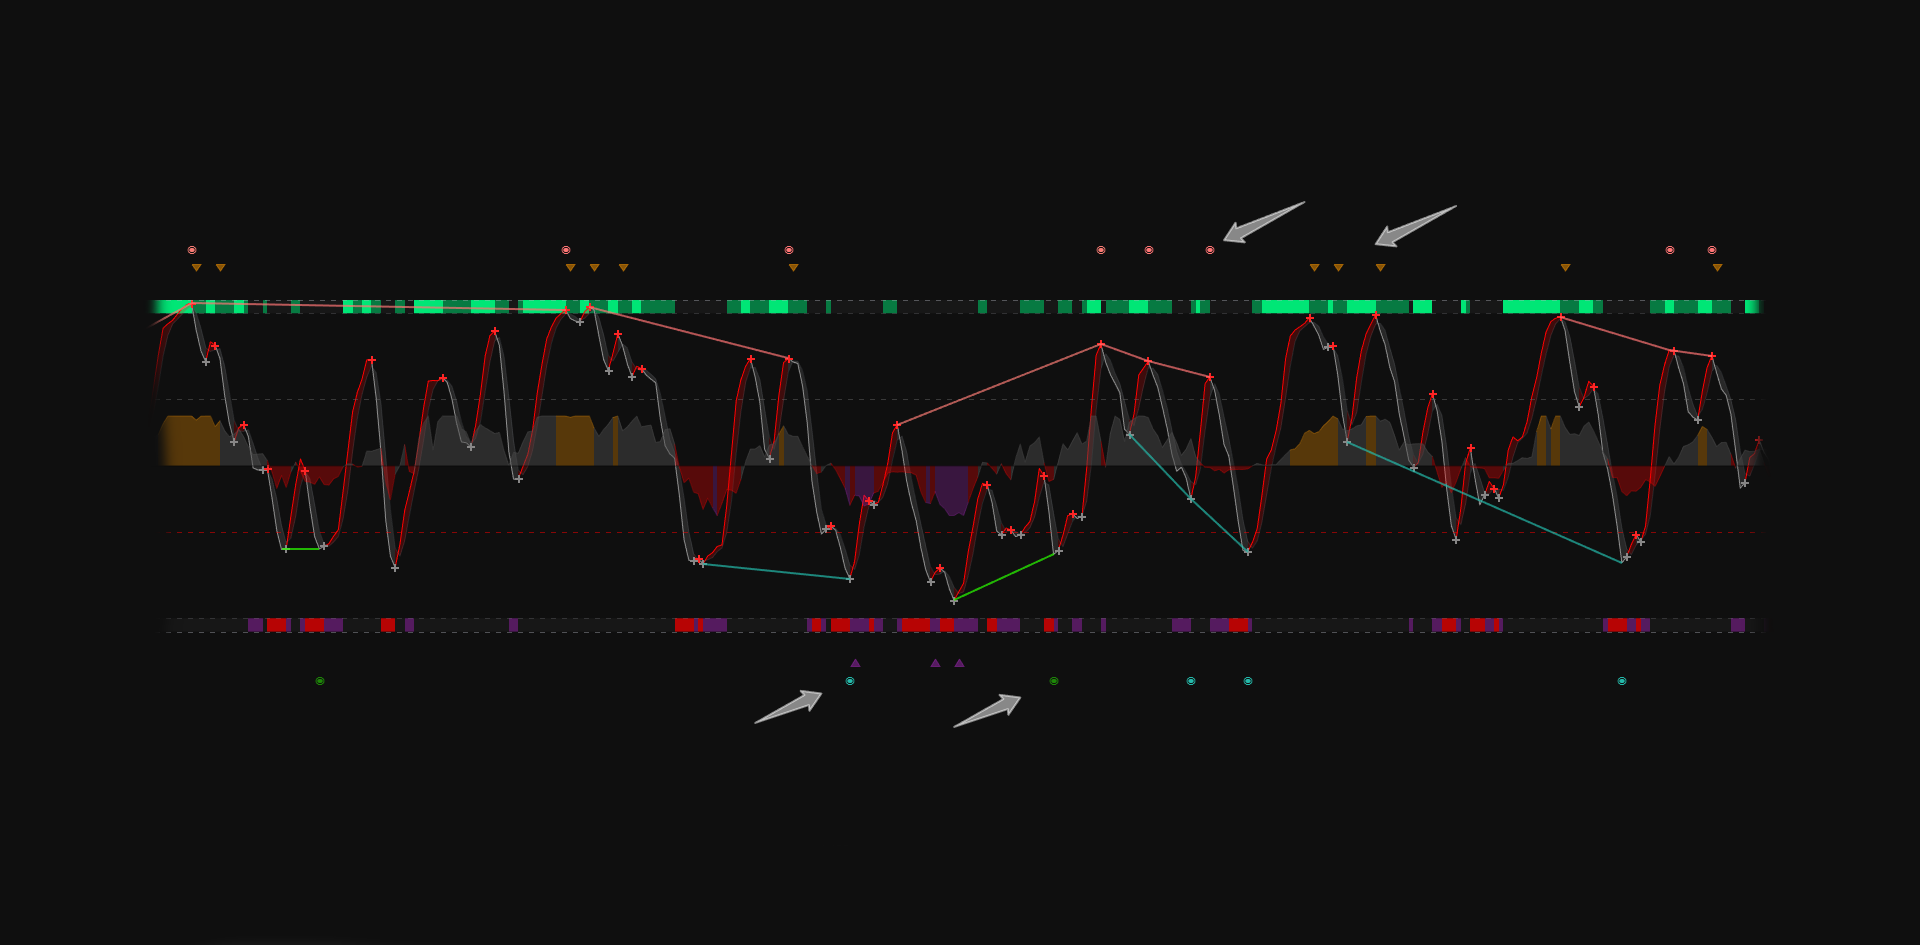
4) Cross Markers + Filtered Triangles
Cross markers show RSI/Signal crosses. Optional triangles highlight stricter “momentum + flow + location” conditions.
Cross markers
Shows crossover / crossunder of RSI vs Signal for clean momentum shifts.
Buy triangle
Requires cross up + MFI in oversold (or recently oversold) + RSI below a threshold.
Sell triangle
Requires cross down + MFI in overbought (or recently overbought) + RSI above a threshold.
Use as prompts
Triangles are “heads-up” prompts — confirm with structure and risk rules.
(Liquidity Hunter provides that context).
5) Divergences (Regular + Hidden)
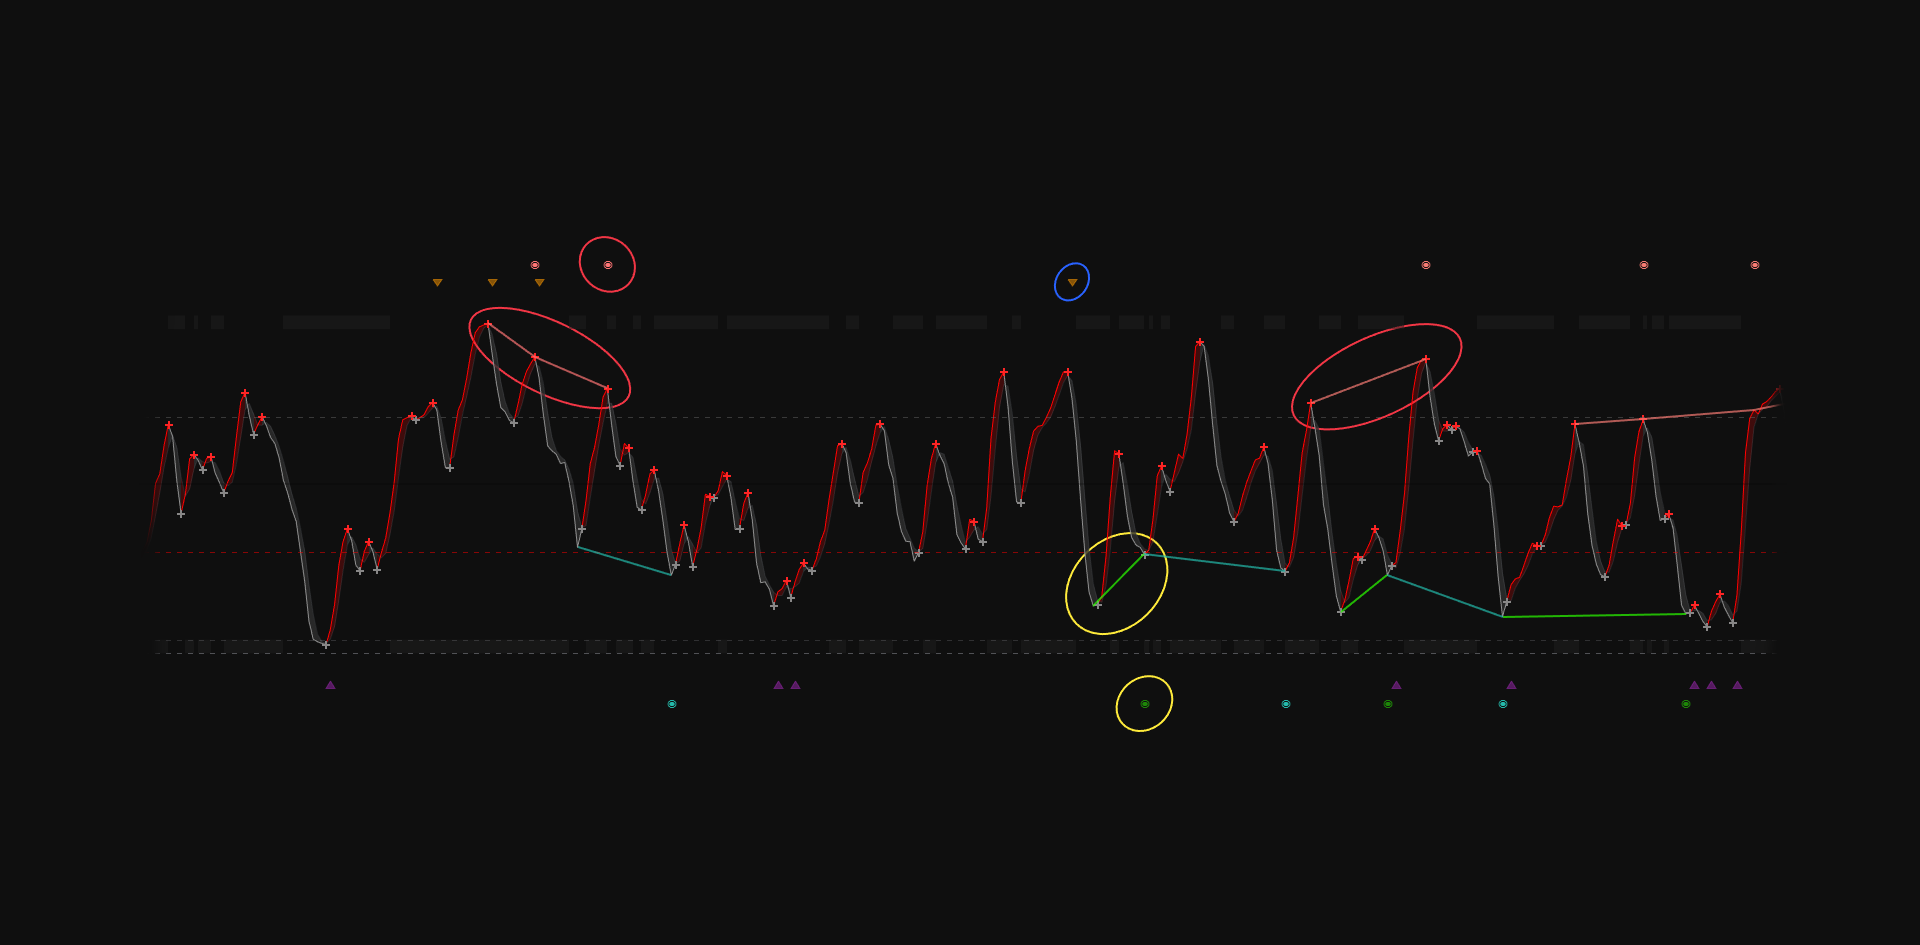
Built-in divergence engine using RSI pivots, with configurable peak distances and optional cleanup.
- Regular divergences: highlights classic momentum disagreement with price.
- Hidden divergences (optional): can be enabled for continuation-style clues.
- Pivot synchronization: price pivots are synced with RSI pivots within a configurable window.
- Delete broken lines: optional cleanup to keep only the most relevant divergences visible.
and confirm with your structure/levels.
Recommended Workflow (iFlow + Liquidity Hunter)
One clean process that avoids overtrading and keeps decisions objective.
- Start with Liquidity Hunter: define trend bias and key zones (structure first).
- Open iFlow: check whether momentum (Zero-RSI) agrees with your bias.
- Confirm with flow: if Money Flow pressure supports the move, probability improves.
- Use divergences as warnings: reduce size or tighten rules when divergence appears near key zones.
iFlow helps confirm WHEN momentum and flow are actually ready.
Access & Activation
Private TradingView script delivery.
- Access period: 1 Year.
- Updates: included during access period.
- Activation: typically within 24 hours.
- TradingView username: required to grant access.
It does not provide financial advice and does not guarantee results.
Related products
-
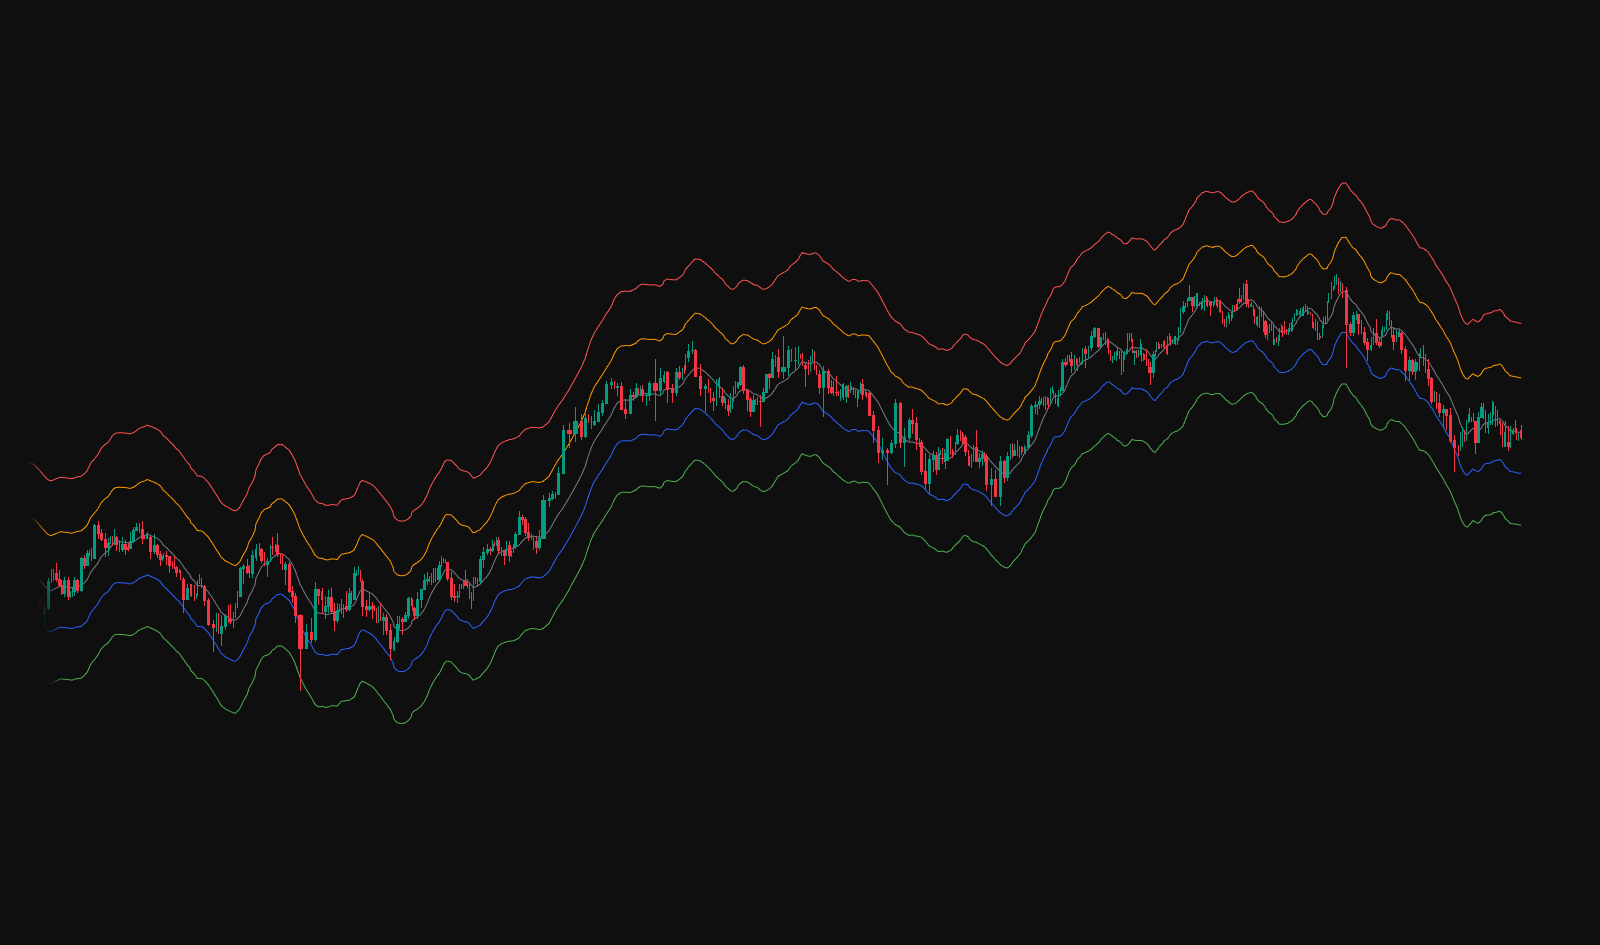
Safety Trade – Public on TradingView
Free · Safety Trade A clean TradingView overlay with structured reference levels for clarity and discipline. Built to keep charts readable and help you stay objective across timeframes. Public on TradingView · All updates included · No activation required. -
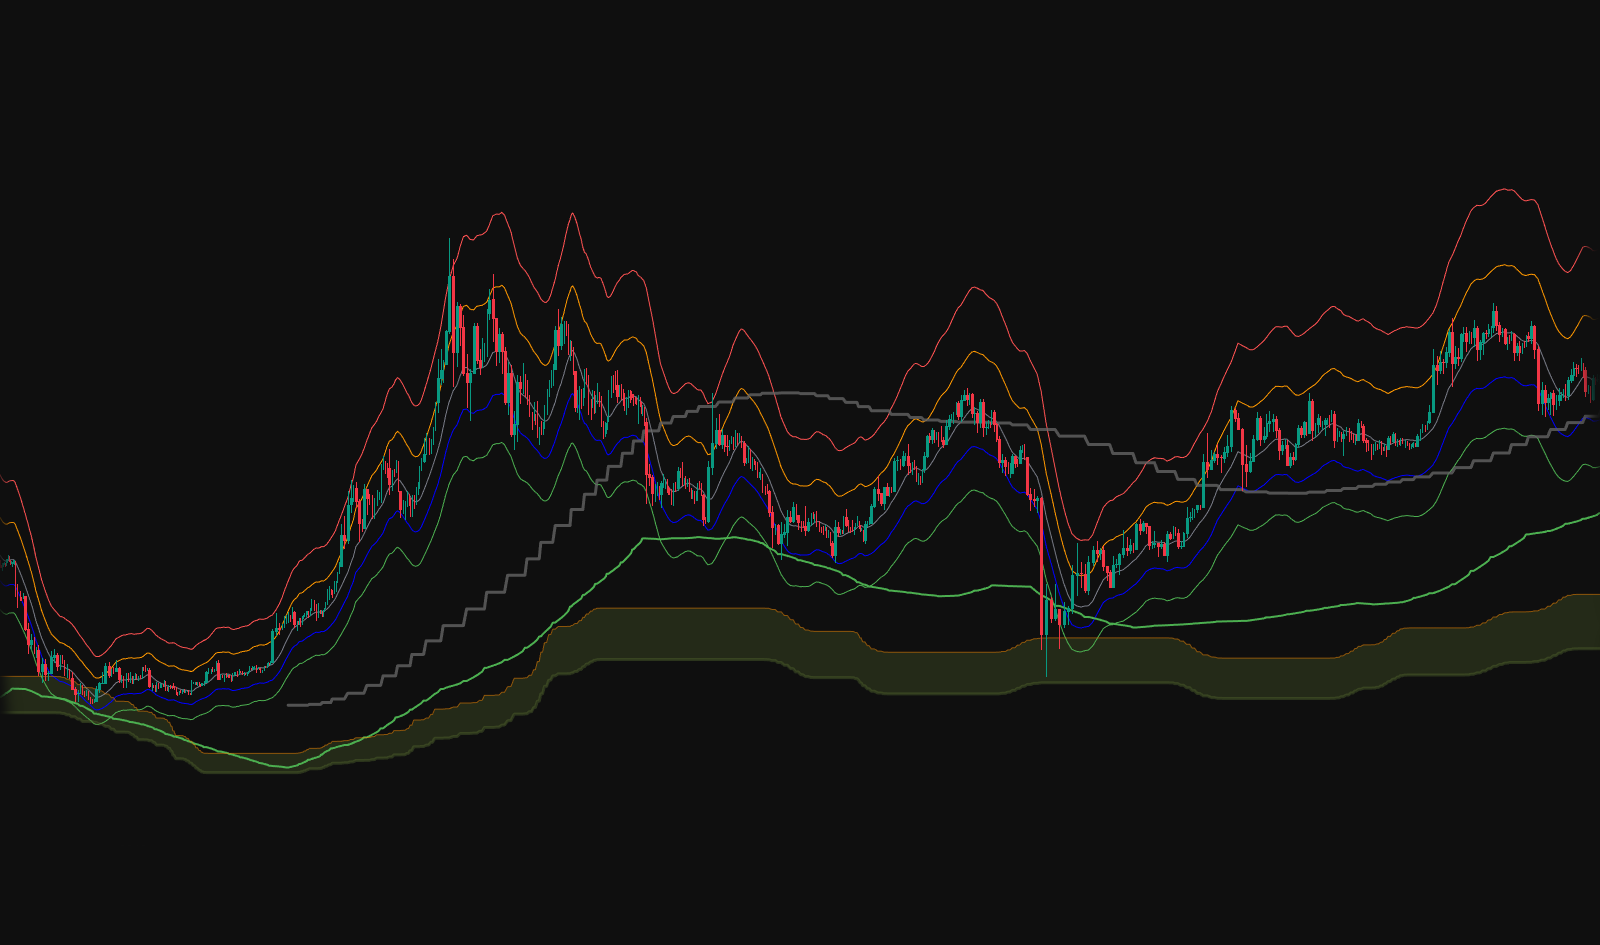
RUMIANCEV Core Suite — Bonus (Free with Bundle)
RUMIANCEV Core Suite — Bonus (Free with Bundle) A compact “core overlay” combining Safety Trade levels, Multi-TF Trap Lines (incl. Monthly), ATR Support Line, and Axel Alts supports. Built to keep charts clean, reduce noise, and support a structured decision process. Included with Liquidity Hunter + iFlow bundle · Activation within 24 hours · All updates included · TradingView username required -
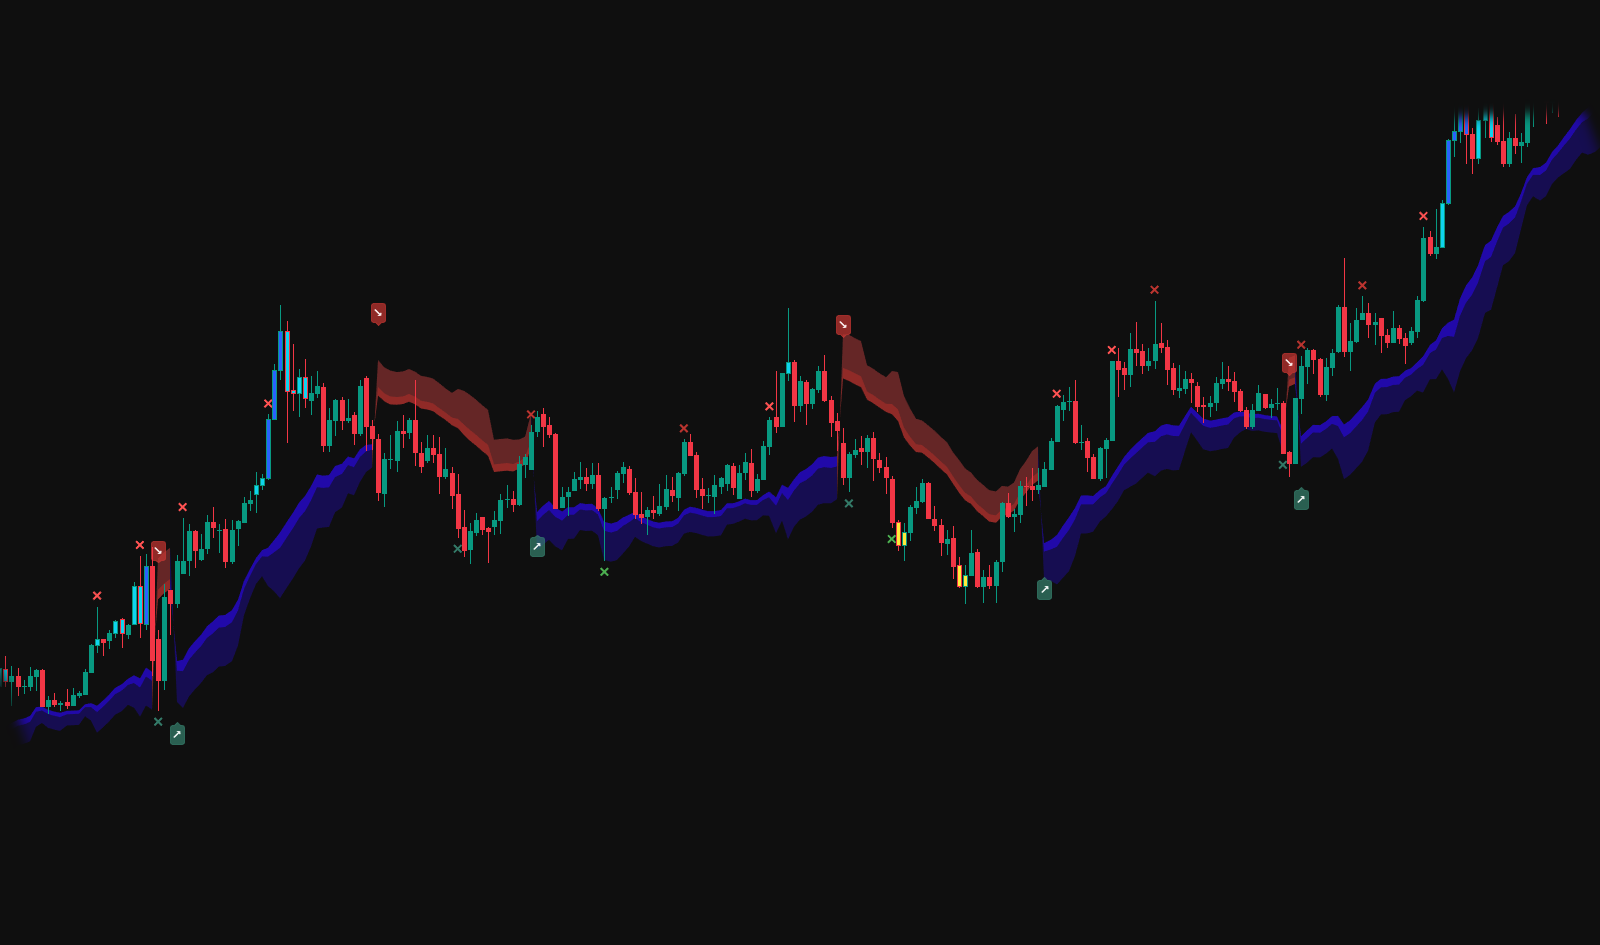
Smart Trend Old
Smart Trend (Legacy) · By Request (Included) Earlier Smart Trend module: clean trend direction + structured zones for disciplined context. Provided as a private add-on after selected premium purchases. Activation within 24 hours · All updates included · TradingView username required.$9.99 -
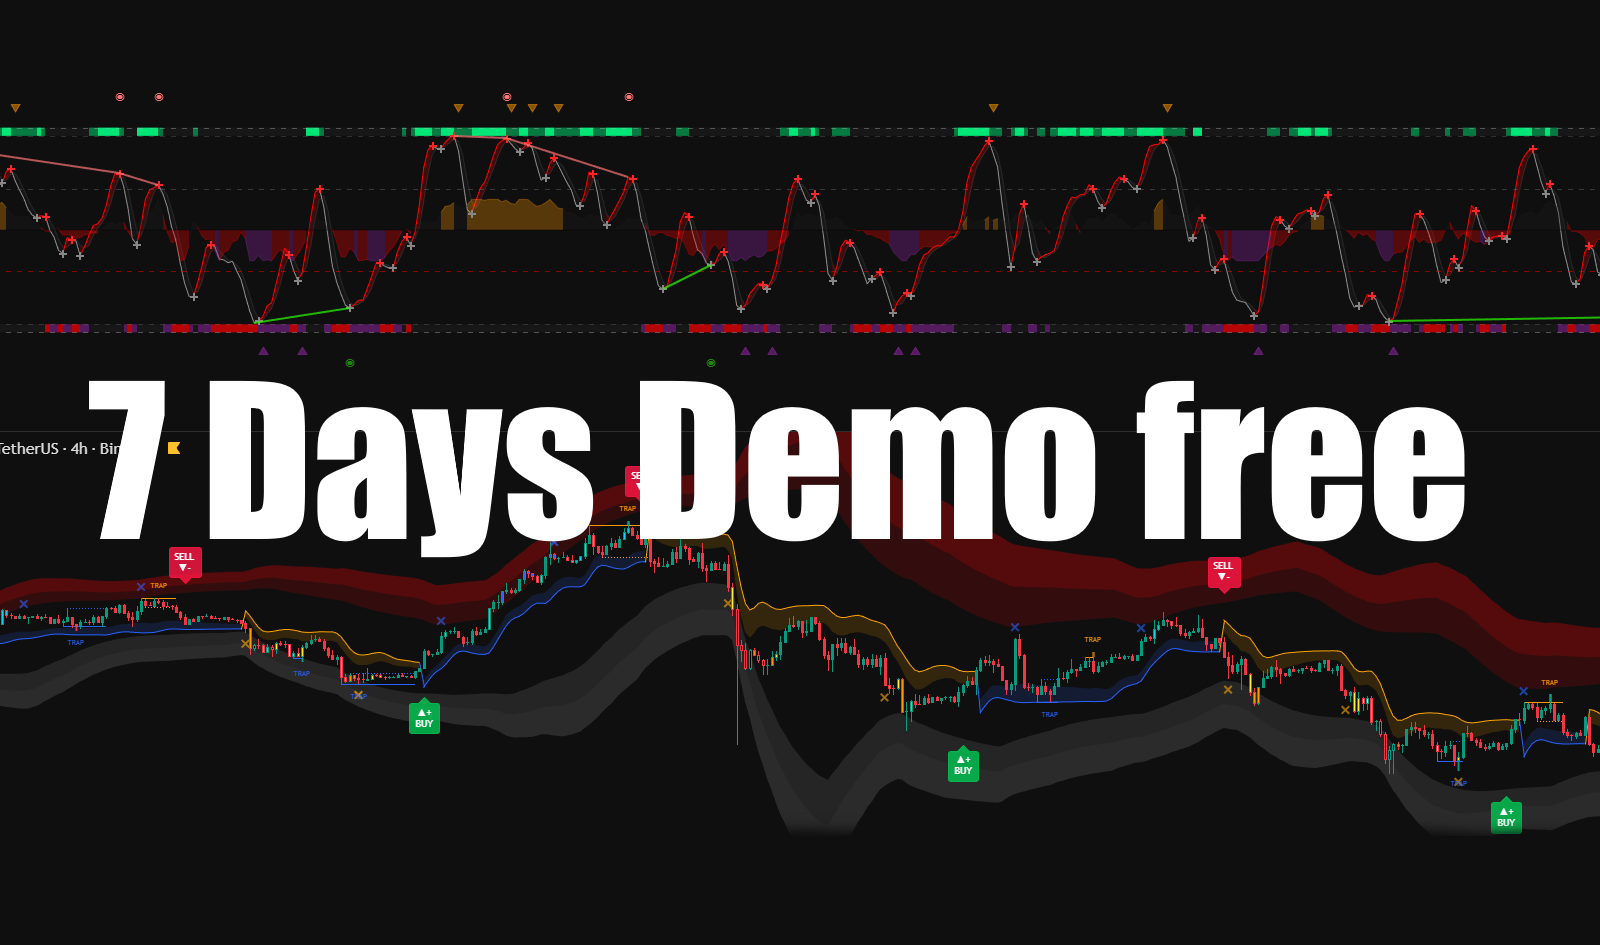
Test Indicator — 1-Week Demo Access
7-Day Demo Access Test the full RUMIANCEV workflow — indicators, signals and tools. Explore the logic and experience before upgrading to full access. Free demo · TradingView only · TradingView username required$0.00